
How to Select the Best Data Visualization Software for Your Business

Data Visualization Software is business tool used to collect, manipulate, analyze raw data, and convert it into visual figures, charts and tables. Data visualization is a term used to refer to the process of presenting structured data in visual or pictorial format such as charts or graphs. Data is becoming increasingly important with every passing minute and a huge amount of data is being generated every second across the globe.
It is estimated that the amount of data generated in the last 2 years far exceeds the amount generated in the entire history of the human race and it is estimated that by 2020, about 1.7 megabytes of data will be created every second by every person, resulting in an accumulated 4.4 zettabytes (44 trillion gigabytes) amount of data.
Businesses are trying to leverage on these huge amounts of data to improve business processes, which brings about the concept of data sciences. Data scientists have come up with several ways to extract and analyze these data in its raw form, and one the methods of data analysis is data visualization.
Data Visualization tools are useful in making data-driven insights, available to workers in an organization. They are also used to identify correlations and patterns between business performance and operations in an organization. With user friendly interfaces and easy-to use features, the data visualization software is easier to operate than most conventional data science tools. When applied in business, it enables you to recognize patterns and relationships between several business variables.
The tool employed in data visualization is known as a data visualization software. In the pioneering years of Big Data, large corporate industries, small and medium sized enterprises (SME’s) acquired huge sets of data and needed the data visualization tool to help them get quick overviews of this massive data bank.
Data visualization systems is playing an important role in advanced analytics involving large and complex data sets. Data visualization tools can be applied in several areas of business and this article provides an in-depth information into the features and benefits of the software.
You may like to review the Best Practices in Data Visualization
Data Visualization software is a type of software that helps organizations visualize data in a meaningful and impactful way. The software provides tools to create charts, graphs, maps, and other visual representations of data, making it easier for users to understand patterns, trends, and relationships in their data. Data Visualization software can support a wide range of data sources, including databases, cloud applications, and spreadsheets, and can be used to create interactive visualizations that can be filtered, drilled-down, and explored.
The software can help organizations uncover insights and make data-driven decisions, and it can also be used to create engaging presentations and reports. Data Visualization software can be used across various industries and functions, including sales, marketing, finance, human resources, and operations, to analyze data, monitor performance, and communicate results to stakeholders. By visualizing data, Data Visualization software makes it easier for organizations to understand their data, make informed decisions, and drive business growth.
What are the Types of Data Visualization Software
There are two basic types of data visualization software – on premise and cloud-based.
- On Premise Data Visualization software: This refers to data visualization software that is located and installed on the client’s computer. This software operates on the computer resources of the client and can easily be customized to suit the client’s needs.
- Cloud Based Data Visualization Software: This refers to data visualization software hosted by a third-party and accessed via the internet. This software does not utilize the client’s computing resources and is usually accessed based on a subscription fee.
Depending on company`s needs, business requirements and future goals, there are several types of Data Visualization Software available based on licensing model:
- Open Source Data Visualization Software : These are Open Source Software where the source code is available.
- Free Data Visualization Software : These are limited versions of a fully functional propriety Data Visualization Software.
- Proprietary Data Visualization Software : Full paid version of Data Visualization Software which is available either in cloud or standalone client server architecture.
You may like to review: Top Data Visualization Software, Free, Open Source and Top Data Visualization Software and How to Select the Best Data Visualization Software for Your Business
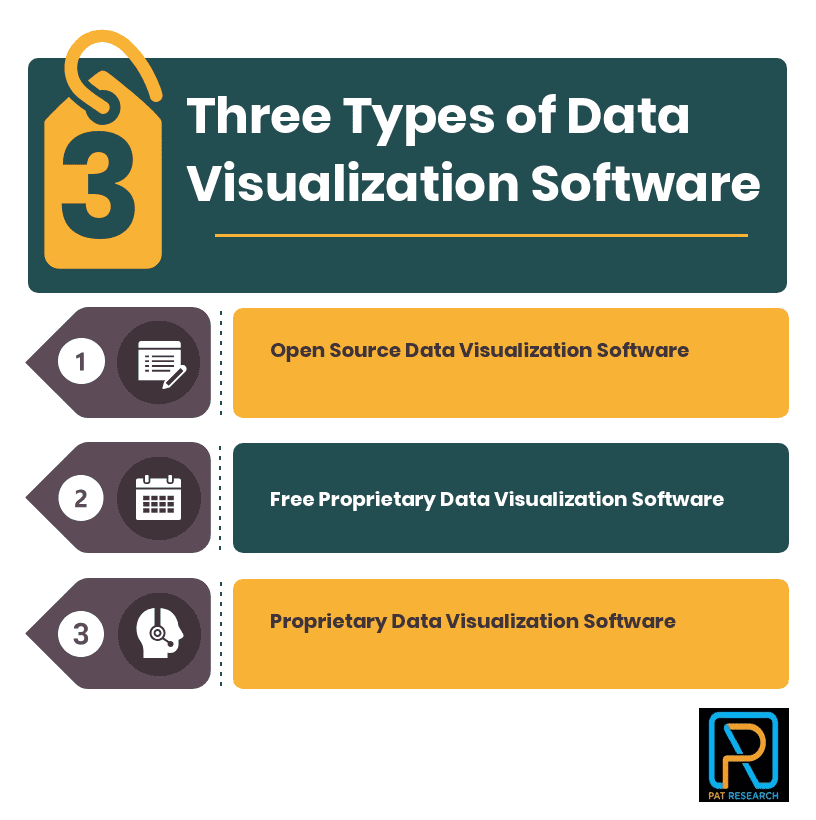
Three Types of Data Visualization Software
What are the Features of Data Visualization Software
Data Visualization communicates information clearly and efficiently via statistical graphics, plots and information graphics. In Data Visualization, the numerical data may be encoded using dots, lines, or bars, to visually communicate a quantitative message. Data Visualization helps users analyze and reason about data and evidence. It makes complex data more accessible, understandable and usable. Users may have particular analytical tasks, such as making comparisons or understanding causality, and the design principle of the graphics. Some of the important features your should look out for in a data visualization solution include Visual Analytics, In-place filtering, visual pivoting, Visual Discovery, Data Visualization, and Ad Hoc Analysis.
Below is a quick summary of all of the following features:
- Data Visualization: This is the most important feature of the data visualization software, that allows you to analyze data in visual form (patterns, graphs, charts, trends and correlations).
- Mobile User support: Sometimes you might need to access your data visualization solutions outside of working environment, therefore it is important that your software can be used on mobile devices.
- Role-based Access Management: This feature allows you to regulate access and usage of a user to the data visualization software, usage in this context refers to the ability of a user to perform specific functions on the software
- Historical Snapshots: With the data visualization software, you can create snapshots of your data samples and workspace at different points in time to be used as records when needed.
- Email Reporting: The data visualization software provides you with constant information and visual statistical reports about your data in form of emails as scheduled.
- Template Creation: The data visualization software allows you to save previously used color schemes or combination in form of templates, to enable you use them for future projects.
- Visual Analytics: Visual Analytics is an important feature of the data analytics software that allows you to analyze huge amounts of data using powerful interactive visual interfaces.
- In-place Filtering: Data visualization tools are often built with an in-filtering feature that allows to filter off certain data either by value, type or category using dropdowns, checkboxes, radio buttons, sliders and others.
- Visual Pivoting: Business analysts often make use of pivot tables for large analysis. Data visualization software provides an easy and powerful platform that allows you to summarize data for analytics.
- Visual Discovery: Visual data discovery is a useful business process that enables you to find patterns, sequences and outliers in data sets by visual analyzing the data. This feature allows you to analyze your business data without necessarily creating data models
- Data Cleansing: Data-sets usually comes in various formats and often contain redundant and inaccurate information; the data cleansing feature enables to remove data that is either inaccurate or incomplete from your database.
You may like to review the Free, Open Source and Top Data Visualization Software
What are the Benefits of Data Visualization Software
Human visual processing is efficient in detecting changes and making comparisons between quantities, sizes, shapes and variations in lightness. When properties of symbolic data are mapped to visual properties, humans can browse through large amounts of data efficiently.
- Establishing Relationships and Correlations: With the data visualization, it is possible to identify relationships and patterns between business results and daily operations; it also allows you to compare your current business performance to past performances.
- Direct Interaction with data: With various data related features, the data visualization software makes it possible to manipulate and engage with raw business data and not just tables, maps and charts. It also allows you to perform data analysis in real time.
- Identify trends faster: The data visualization software enables you to spot changes and trends in your customer and market data more quickly to avoid getting lost in the huge amount data that you have to deal with.
- Accurate customer habit analysis: With the data visualization software, you can gain a deeper insight into customer sentiments and can come up with better services to please your customers.
- Predictive Business Analysis: With the data visualization software, you can conduct predictive analysis using existing business information to gain insight into which products and services are under performing and how to improve their sales.
What are the Latest trends in Data Visualization Software
Data visualization is gaining prominence data analytics and it is important for business to keep afloat the emerging trends in data visualization to give them a competitive edge in the industry. Here are some of the latest trends in data visualization you need to be aware of:
- Storytelling: Visual Analytics on its own is not enough anymore, data visualization tools are now engaging the narrative to provide insights into different forms of data.
- Artificial Intelligence: Artificial intelligence, future learning and machine learning are being incorporated into data visualization to enable users detect data patterns faster
You may like to review: Top Data Visualization Software, Free, Open Source and Top Data Visualization Software
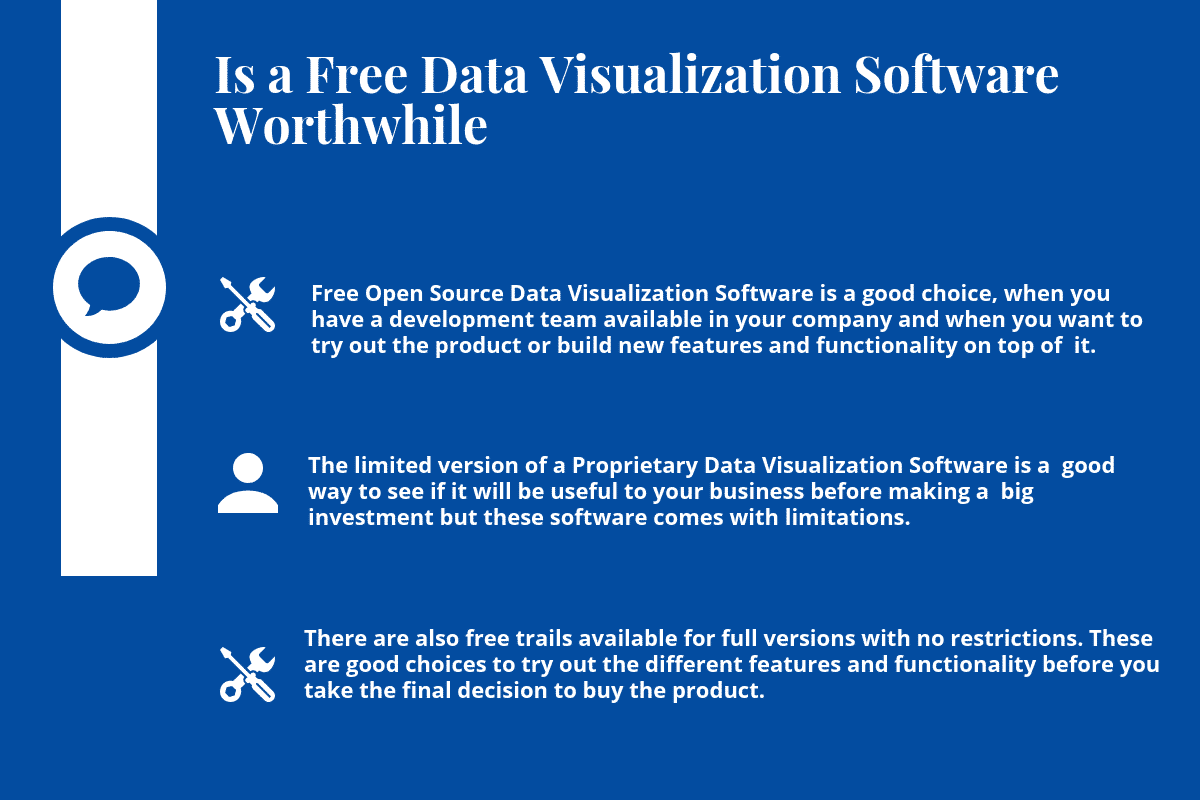
Is a Free Data Visualization Software Worthwhile?
Is a Free Data Visualization Software Worthwhile
Data Visualization Software has many features and can do a lot to help your business to succeed in communicating the KPI's and metrics effectively, but it can be expensive. There are plenty of free Data Visualization Software available. There are two category of Free Data Visualization Software Software : Free Open Source Data Visualization Software and Limited version of a Proprietary Data Visualization Software.
Free Open Source Data Visualization Software is a good choice, when you have a development team available in your company and when you want to try out the product or build new features and functionality on top of it. You need to spend time to set it up and running.
The limited version of a Proprietary Data Visualization Software is a good way to see if it will be useful to your business before making a big investment but these software comes with limitations. A free limited version from a proprietary product company will make it easier to upgrade in the long run and also help you determine if that company’s solution is what you want.
There are also drawbacks to Free Limited version of a Proprietary Data Visualization Software . These limited version do not have nearly as many features available in a fully functional paid version, and there are limits such as number of visualizations, dashboards, storage limits, limited data integration options, and also on the number of users you can have. The free versions also have limited support options.
There are also free trails available for full versions with no restrictions. These are good choices to try out the different features and functionality before you take the final decision to buy the product.
How to choose the right Data Visualization Software
Interactive visualization allows users to change the visual representation of data, select subsets of data, and connect directly to data sources to allow the user to drill down from summary reports to specific data points. Static visualization includes prepacked spreadsheets or reports with flat images and minimal underlying data available.
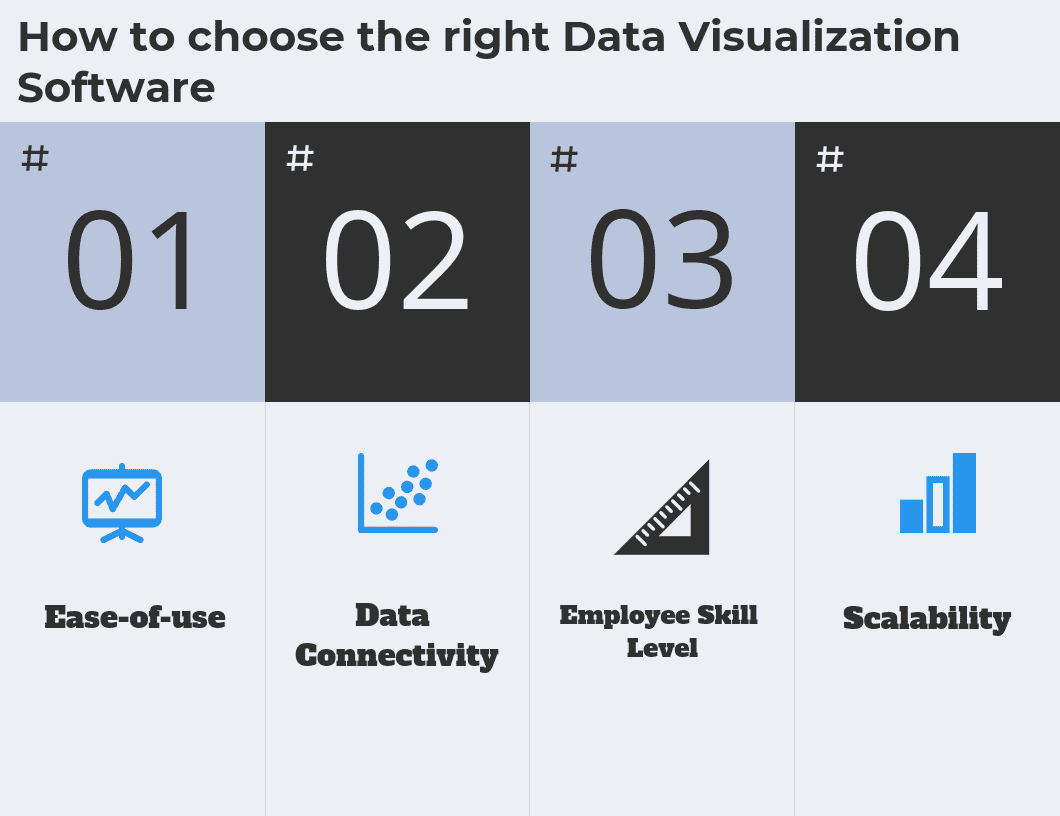
There are important factors to consider when selecting which data visualization solution is best for your business. In addition to flexibility and analytical functionalities, here are some other things to consider when choosing a software:
- Ease-of-use: It is important that any data visualization software that you decide to implement has easy-to-use features and a user-friendly interface for less technical employees
- Data Connectivity: A good data visualization software has the ability to connect with or extract important information from external sources when you encounter data absence problems.
- Employee Skill Level: It is also very important for you to consider the technical skill level of your employees before buying a software, as you do not want to incur additional costs training your employees on usage.
How to choose the right Data Visualization Software
Top Data Visualization Software
You may like to review the Free, Open Source and Top BigData Visualization Software


Top Free Proprietary Data Visualization Software
You may like to review the Free, Open Source and Top Data Visualization Software


Top Free Open Source Data Visualization Software
You may like to review the Free, Open Source and Top Data Visualization Software


You may like to review: Top Data Visualization Software, Free, Open Source and Top Data Visualization Software
What are Data visualization Software?
Data Visualization Software is business tool used to collect, manipulate, analyze raw data, and convert it into visual figures, charts and tables. Data visualization is a term used to refer to the process of presenting structured data in visual or pictorial format such as charts or graphs. Data is becoming increasingly important with every passing minute and a huge amount of data is being generated every second across the globe.
What are the Features of Data Visualization Software?
Data Visualization communicates information clearly and efficiently via statistical graphics, plots and information graphics. In Data Visualization, the numerical data may be encoded using dots, lines, or bars, to visually communicate a quantitative message. Data Visualization helps users analyze and reason about data and evidence. Some of the important features your should look out for in a data visualization solution include Visual Analytics, In-place filtering, visual pivoting, Visual Discovery, Data Visualization, and Ad Hoc Analysis.
Is a Free Data Visualization Software Worthwhile?
Data Visualization Software has many features and can do a lot to help your business to succeed in communicating the KPI's and metrics effectively, but it can be expensive. There are plenty of free Data Visualization Software available. There are two category of Free Data Visualization Software Software : Free Open Source Data Visualization Software and Limited version of a Proprietary Data Visualization Software.
How to choose the right Data Visualization Software?
Interactive visualization allows users to change the visual representation of data, select subsets of data, and connect directly to data sources to allow the user to drill down from summary reports to specific data points. Static visualization includes prepacked spreadsheets or reports with flat images and minimal underlying data available.


By clicking Sign In with Social Media, you agree to let PAT RESEARCH store, use and/or disclose your Social Media profile and email address in accordance with the PAT RESEARCH Privacy Policy and agree to the Terms of Use.