Sign in to see all reviews and comparisons. It's Free!
By clicking Sign In with Social Media, you agree to let PAT RESEARCH store, use and/or disclose your Social Media profile and email address in accordance with the PAT RESEARCH Privacy Policy and agree to the Terms of Use.
Phocas is a governed data discovery application with an HTML5/Javascript presentation layer.Phocas delivers a simple, powerful analytical capability that quickly turns data into a chart, graph or map at the click of a mouse or touch of a screen
8.1
Editor Rating
8.1
Aggregated User Rating
5 ratings
You have rated this
Phocas BI Software : Phocas is a governed data discovery application with an HTML5/Javascript presentation layer, Microsoft.NET business logic layer and Microsoft SQL Server database layer.The web application is deployed on premise or in the cloud on Microsoft IIS7. Access to the application is available to any HTML5 compliant browser running on a desktop or on any mobile device.
Phocas delivers a simple, powerful analytical capability that quickly turns data into a chart, graph or map at the click of a mouse or touch of a screen. Phocas dashboards gives a stunning visual summary of data, letting to spot check for success and share the results with other users.
In addition to connectivity to all ODBC & JDBC compliant databases Phocas also provides connectors for most ERP and CRM systems. Phocas can be deployed on premise, hosted - Phocas private cloud, cloud – software as a service and local. Phocas Mobile is available with all deployment options and compatible with all browsers with HTML5 support.
Phocas run on Hybrid In-memory/on disk storage database technology and provides fast performance with the Phocas indexing algorithm technology, which collects, parses and stores data for fast and accurate retrieval. The indexing algorithm design incorporates interdisciplinary concepts from linguistics, cognitive psychology, mathematics, informatics, physics and computer science.
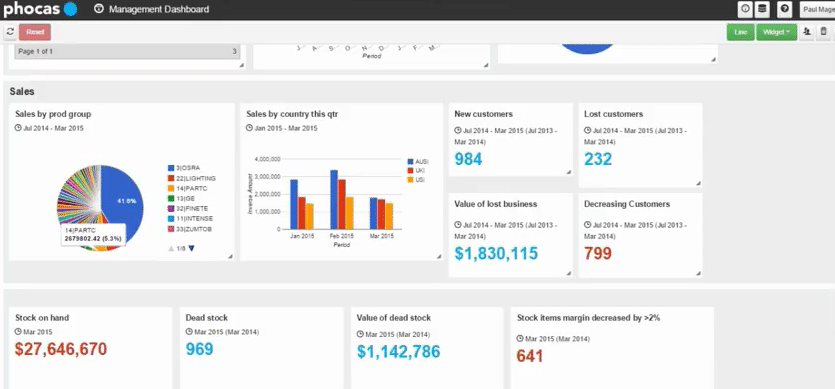
The main focus dashboard can contain various KPIs and visualizations that users can customize to better suit the users’ need or occupation.
Company size
Medium (50 to 1000)
User Role
End User
User Industry
Health care
Rating
Ease of use8.2
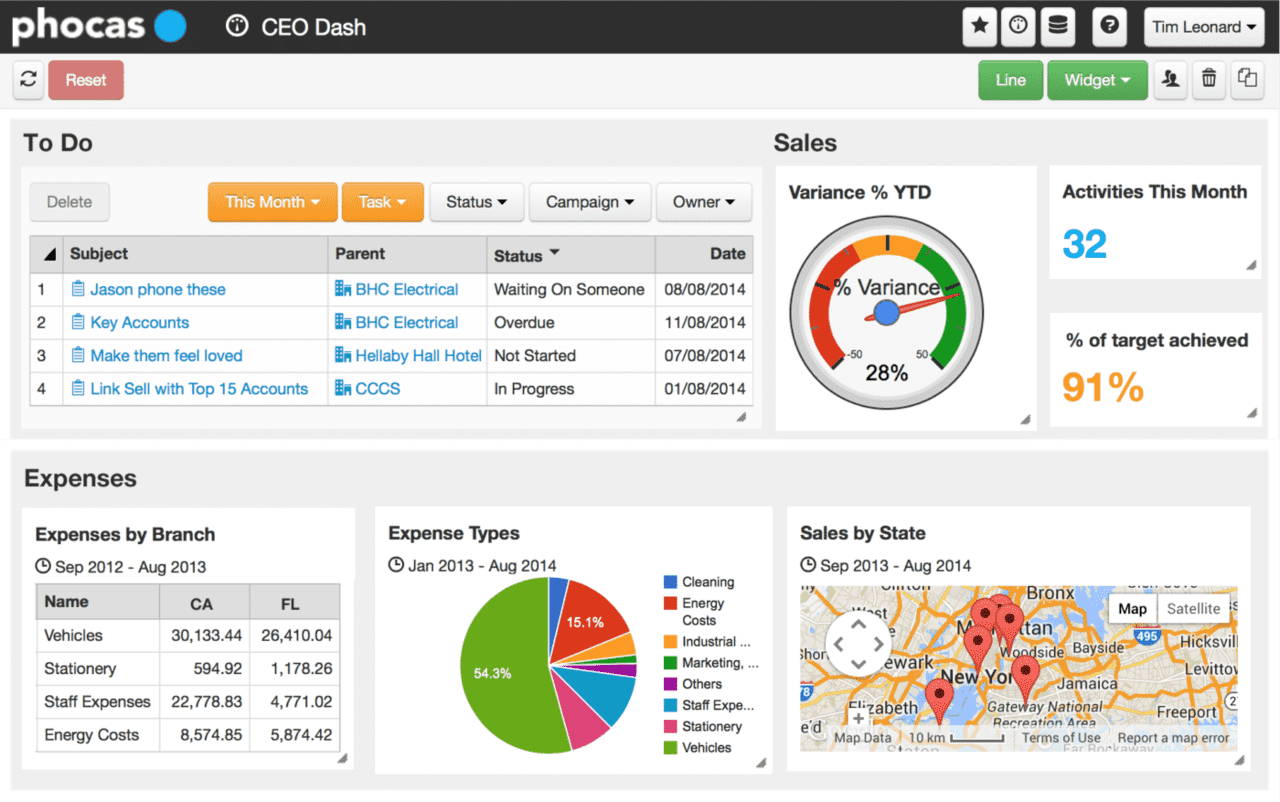
Users can switch to different dashboards from the main dashboard to a much in depth dashboard with the tool on the upper right corner of the dashboard.
Features & Functionality8.2
Main focus dashboard is highly customizable and lets users see the big picture where users can set up for it to display the sales performance like year to date sales, last month sales and healthy profit.
Advanced Features8.1
When users make a dashboard with sales personnels’ performance, it provides a personnels’ name and a gauge and when the name is clicked the gauge is updated with the personnel’s performance.
Integration8.2
Performance8.1
Training 8.1
Customer Support8.1
Implementation8.2
Renew & Recommend7.6
ADDITIONAL INFORMATION The main dashboard is customizable for the users’ needs. From the dashboard, users can also set up a gauge to further analyze a team member’s performance be it sales or as an employee which will help users assess or evaluate the member.
Pillar buttons are a great way to save time selecting and finding the right data the users are looking for and is analyzing.
Company size
Medium (50 to 1000)
User Role
Super User
User Industry
Financial services
Rating
Ease of use8.2
The phocas’ dashboard provides a drop down list on the upper right corner to change the view of a list to easily see quarterly, fiscal year to date or the current year view of the users’ organization’s performance or they can even use the reset button on the left side of the dashboard to go back to the default view.
Features & Functionality8.1
Pillar buttons sorts data into logical groupings or categories for users to easily navigate through details on the left side of the screen.
Advanced Features8.1
Variance mode can easily compare details from the past year to the current year and can be sorted going up or going down to really see the difference for example in sales.
Integration8.1
Performance8.5
Training 8.2
Customer Support8.2
Implementation8.1
Renew & Recommend8.2
ADDITIONAL INFORMATION Phocas makes it easy to navigate through data and drill down on a more in depth information and pillar buttons can also help in maximizing time and organizing data.
Offers a cloud-based and fully integrated suite of business intelligence tools for businessesin the manufacturing industry.
Company size
Small (<50)
User Role
Consultant
User Industry
Energy
Rating
Ease of use8.2
Features & Functionality8.1
Advanced Features8.2
Performance8.2
Implementation8.3
Renew & Recommend8.4
ADDITIONAL INFORMATION Phocas – system provides users with the ability to view data from many different perspective. The system also enables users analyze sales information, including trends and buying patterns, to determine cross-selling opportunities and sale opportunities. System identifies customers who fall into a pattern of not purchasing or decline in purchasing frequency.


Useful Dashboards
The main focus dashboard can contain various KPIs and visualizations that users can customize to better suit the users’ need or occupation.
Medium (50 to 1000)
End User
Health care
Users can switch to different dashboards from the main dashboard to a much in depth dashboard with the tool on the upper right corner of the dashboard.
Main focus dashboard is highly customizable and lets users see the big picture where users can set up for it to display the sales performance like year to date sales, last month sales and healthy profit.
When users make a dashboard with sales personnels’ performance, it provides a personnels’ name and a gauge and when the name is clicked the gauge is updated with the personnel’s performance.
ADDITIONAL INFORMATION
The main dashboard is customizable for the users’ needs. From the dashboard, users can also set up a gauge to further analyze a team member’s performance be it sales or as an employee which will help users assess or evaluate the member.
Easy to navigate through data and drill down
Pillar buttons are a great way to save time selecting and finding the right data the users are looking for and is analyzing.
Medium (50 to 1000)
Super User
Financial services
The phocas’ dashboard provides a drop down list on the upper right corner to change the view of a list to easily see quarterly, fiscal year to date or the current year view of the users’ organization’s performance or they can even use the reset button on the left side of the dashboard to go back to the default view.
Pillar buttons sorts data into logical groupings or categories for users to easily navigate through details on the left side of the screen.
Variance mode can easily compare details from the past year to the current year and can be sorted going up or going down to really see the difference for example in sales.
ADDITIONAL INFORMATION
Phocas makes it easy to navigate through data and drill down on a more in depth information and pillar buttons can also help in maximizing time and organizing data.
Offers a cloud-based and fully integrated suite of business intelligence tools for businessesin the manufacturing industry.
Small (<50)
Consultant
Energy
ADDITIONAL INFORMATION
Phocas – system provides users with the ability to view data from many different perspective. The system also enables users analyze sales information, including trends and buying patterns, to determine cross-selling opportunities and sale opportunities. System identifies customers who fall into a pattern of not purchasing or decline in purchasing frequency.