
How to Select the Best Dashboard Software for Your Business

Dashboard is a very important tool for monitoring and controlling the situation within an organization. In a simple graphic interface and in one place, it displays the key performance indicators (KPIs), and thus, allowing quick and easy insight into the business data. Dashboard displays information visually, often with the text and graphics combination, but the general emphasis is on the graphics.
The reason for that is because graphics presentation provides us with more information. There is one common characteristic for all the information found on a dashboard: that is they are abbreviated in the form of abstracts and exceptions. This is because it is impossible to track all the details needed to carry out a specific task at first glance.
To make good and functional dashboard, we always have to focus on the main goal – communication. And more than anything else, we have to be careful that people who use the dashboard can understand it, quickly and clearly. If the dashboard is made for some other reason, no matter how impressive, it will become very tedious after just a couple of days, and eventually, it will be completely discarded.
While using the dashboard, users` demands and expectations change, and for that reason, dashboards must have the ability to be modified. It is also important to train users for future maintenance, thereby reducing the dependence on external resources.
A dashboard is a graphical interface that provides real-time updates and visualizations of key metrics and performance indicators. Dashboards are typically used to display data in an easy-to-understand format and provide quick insights into business operations and performance. Dashboards can be customized to show specific data sets and visualizations, and they can be accessed from a computer or mobile device.
Dashboards can be used across various industries and functions, including sales, marketing, finance, human resources, and operations, to track key performance indicators, monitor business performance, and make informed decisions. They can be integrated with various data sources, such as databases, cloud applications, and spreadsheets, and can support real-time data updates, historical data analysis, and predictive modeling. Dashboards provide a powerful tool for organizations to gain visibility into their operations, identify trends and patterns, and make data-driven decisions.
You may like to read: What is Dashboard Software?, Top Dashboard Software , and Open Source, Free and Top Dashboard Software
What is Dashboard Software?
Dashboard provide at-a-glance views of Key Performance Indicators (KPI) and integrates data from a variety of sources and provides a unified display of relevant contextual information. Unlike reports, which tend to contain a fixed amount of information, dashboards have the ability to deliver real time or near real time information on demand, as needed by the dashboard user.
Dashboards help organizing historical information in the hands of business analysts and executives by using the data found in relational databases, data warehouses and data marts to generate at a glance view that informs executives and senior departmental managers of strategic, tactical and operational trends and opportunities.
Dashboard Software have become very popular in recent years as powerful tools for viewing all essential information on a single screen. Although dashboard possesses great potential, this potential is rarely and incompletely used. The root of this specific problem is poor and deficient data presentation. Today, almost every organization uses dashboard tools, and will continue to use them because they provide a lot of information summarized in one place, which facilitates greatly the control over the movements of certain company measures, allowing better and easier control over the company/organization.
What Type of Dashboard Software is right for your business?
In recent years, Dashboards has come to rely on near real-time operational data found in systems including enterprise resource planning (ERP), customer relationship management (CRM), supply chain, marketing and other databases. This Operational BI is meant to provision many more functions in the organization with role-specific dashboards.
Dashboard can be classified as belong to three types which include Operational Dashboard, Strategic Dashboards and Analytical dashboards.
Operational dashboard monitors business processes and tracks the current performance of KPIs. This dashboard supervises progress towards the target and because of that, it updates frequently. Strategic Dashboard is used by executives to monitor KPI status. The data is updated less frequently than an operational dashboard. Analytical dashboard analyzes vast amounts of information allowing its users to discover insights and predict outcomes. The data may be updated infrequently.
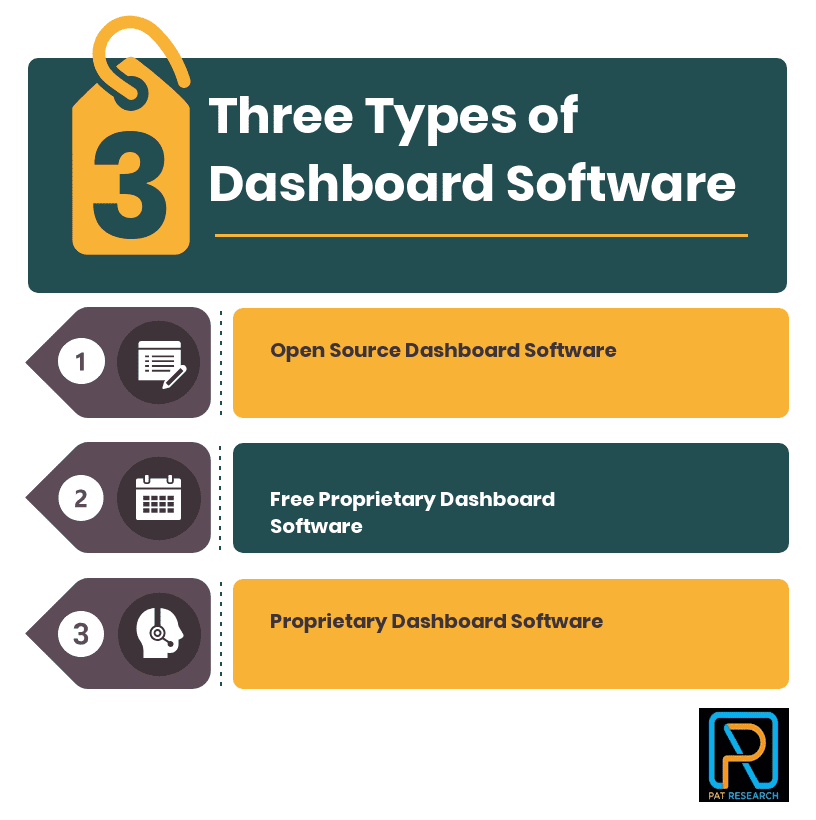
Three Types of Dashboard Software
Depending on company`s needs, business requirements and future goals, there are several types of BI Dashboard Software available based on licensing model:
- Open Source Dashboards: These are Open Source Software where the source code is available.
- Free Proprietary Dashboards : These are limited versions of a fully functional propriety Dashboard Software.
- Proprietary Dashboards : Full paid version of Dashboard Software which is available either in cloud or standalone client server architecture.
All these Dashboard Software comes with predefined themes for Dashboard for different business user groups such as Website Dashboards, Sales Dashboards, Marketing Dashboards, Executive Dashboards, KPI Dashboard Software etc.
Website Dashboards which tracks the website performance monitoring. Sales Dashboard tracks the Sales related Key Performance Indicators with the objective to increase the sales. Marketing Dashboards collects KPIs and critical metrics related to marketing activities. Executive Dashboards provide an overview of company`s performance; department level KPI’s and collects data from customer relationship management (CRM), Enterprise Resource Planning (ERP) and website analytics
You may like to read: What is Dashboard Software?, Top Dashboard Software , and Open Source, Free and Top Dashboard Software
What are the Features of Dashboard Software?
Dashboard involves intelligent reporting on top of existing data which helps in prompt and actionable decision making. It is necessary to aggregate the factual data from various data sources with transformations. This data needs to be stored in a data mart or warehouse to enable reporting and analysis on top of it. This data is also aggregated into metrics or Key Performance Indicators which are then reported in a Dashboard. The ability to perform Business Intelligence involves data management and analytics or reporting in a Dashboard. Some of the key elements to a good dashboard are Simple design, which communicates easily to the end users with minimum distractions. A properly designed Dashboard supports organized business with meaning and useful data and applies human visual perception to visual presentation of information.
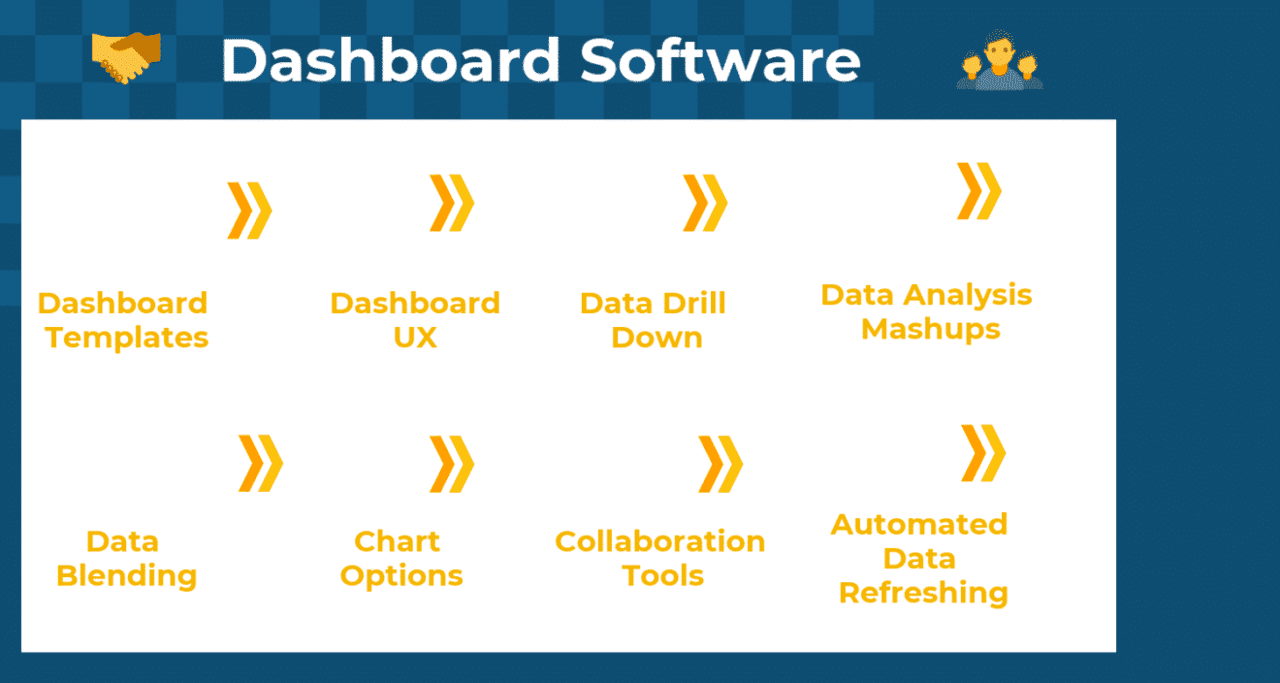
- Dashboard Templates: Provides pre built dashboard templates including widgets as a way to quickly get your dashboard created including the most important metrics from your data. Predefined dashboard themes to change the look of your dashboard quick and easy with personal or default themes.
- Dashboard UX : Dashboard tabs to structures data making it easy to process, Tab rotation feature in combination with a full-screen mode, animation options for chart animations incorporated into dashboards and drag and drop editing.
- Data Drill Down: Drilling down on Dashboard summary by clicking on some representation in order to reveal more detail.
- Data Analysis Mashups: Provides data mashups ability to analyze your metrics by taking different apps and combining them together to create charts and graphs to better analyze the data.
- Data Blending: Combining data from multiple sources into a functioning dataset. This is a quick and straightforward method used to extract value from multiple data sources to find correlations between different data sets.
- Chart Options: Choose between numerous styles, charts, graphs to meaningfully visualize your data on the dashboard.
- Collaboration Tools : Ability to share the dashboards internally with in the departments to enable working together as a team. Establishes a data-driven culture in the organization and shares dashboards with employees and external viewers. Public links: Share dashboards externally with, clients, investors or media via a public URL.
- Global dashboard filters and styles: Easily drills down into data across multiple visualizations, offers users various filter options and saves time. Adjustment and modification of fonts, colors and background colors of all dashboard elements, allowing consistent corporate image.
- Integrate Various Data Source : Built in connectors to integrate various data sources to provide a holistic view from different data sources.
- Automated Data Refreshing: Real time or near real time refresh. Organize and schedule refresh dates and time.
- Collaborate with Excel: Access and analyze data from Excel, import your data to excel.
- Access Anywhere Anytime: 24/7 Dashboard access availability with responsive access from a computer, mobile or tablet.
- Embedded Analytics: Embed dashboards in to Applications.
- Multilingual support: Supports many international languages for more successful collaboration.
- HTML 5 compatibility: HTML 5 compatibility to display rich media on mobile devices.
- Data brushing / Smart Recommendation: Locate the same data across multiple visualizations using data brushing. Provide smart recommendation by visualization recommendations based on personal data selections.
What are the Features of Dashboard Software
Here are the Trending Top Twenty Dashboard Software for your review :
What are the Benefits of Dashboard Software?
Dashboard is the heartbeat of decision making. It makes the data visible and provide insights so that the end users can use those information for their benefits. With Dashboard, you can see your profits, your sales revenue, your costs and operational efficiency. But most importantly, you can dig into the data to discover how those numbers came to be.
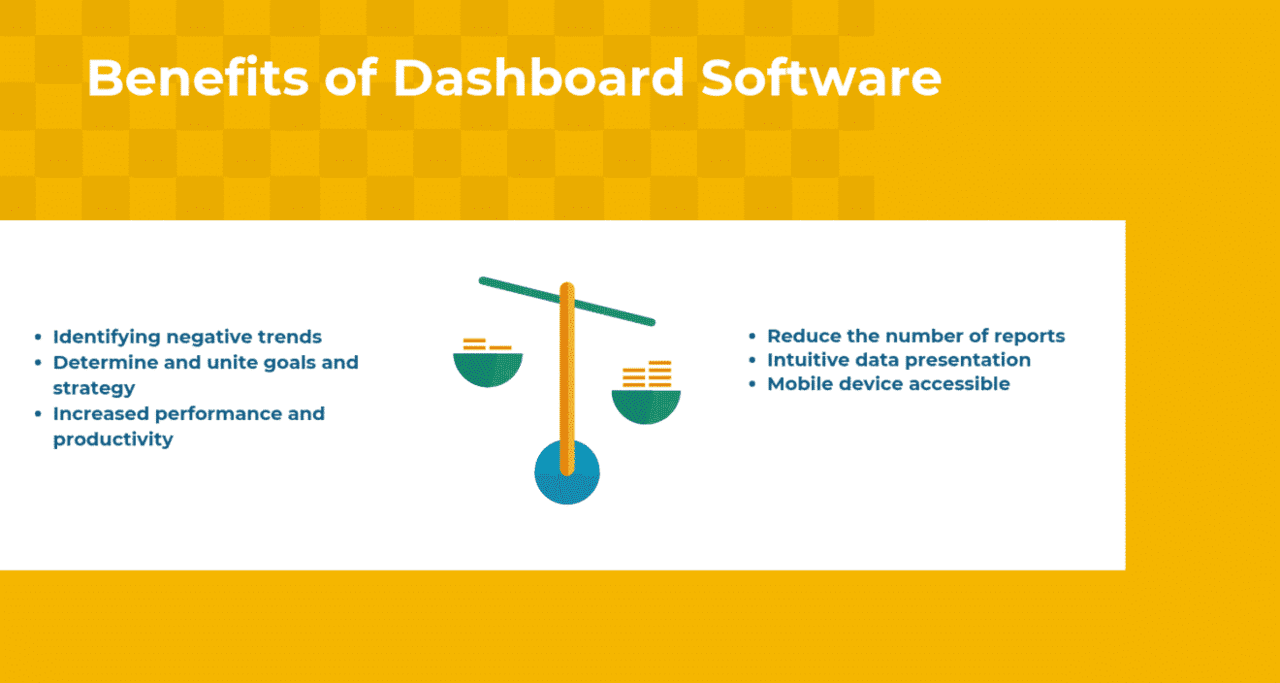
Several benefits are gained from using the right Dashboard Software:
- Identifying negative trends: Helps to identify the trends in your data using the KPI to reduce the influence of negative trends and eliminate them to support the decisions with accurate information.
- Determine and unite goals and strategy: Make sure that decisions are based on the right strategy and align the department and organization to corporate strategy.
- Increased performance and productivity: Helps to increase productivity and spend less time on collateral tasks.
- Reduce the number of reports: Save time due to concentrating data from multiple sources into one.
- Intuitive data presentation: Allows easy data navigation.
- Mobile device accessible: Easily accessible information from anywhere.
- Enhanced collaboration and communication: Every part of the organization has the same goals.
What are the Benefits of Dashboard Software
What are the Latest trends in Dashboard Software?
As the amount of data grows at a very fast pace, so does the need for new and improved visualization tools. The latest trends based on these needs are:
- Self Service Model: Agile, flexible and self-sustaining data analyses to track business performance, eliminate and reduce risks, locate and identify hidden data patterns.
- Cloud : Cloud architecture with minimal internal IT support.
- Governance for Business Intelligence : Enterprise wide governance for Business Intelligence with Constant control over data.
- Social Media Integration: Integrate Marketing and Sales Dashboards with social media data for potential benefits in marketing and customer care.
- Location analytics: Geographic visualization gives the dashboard multi-dimensional touch and encourages location-intelligence data warehousing.
You may like to read: How to Select the Best Dashboard Software for Your Business, Top Best Practices in Dashboard Software, Top Chart Builder Software
Is a Free Dashboard Software Worthwhile?
Dashboard Software has many features and can do a lot to help your business to succeed by tracking your Key Performance Indicators, but it can be expensive. There are plenty of free Dashboard Software available. There are two category of Free Dashboard Software Software : Free Open Source Dashboard Software and Limited version of a Proprietary Dashboard Software.
Free Open Source Dashboard Software is a good choice, when you have a development team available in your company and when you want to try out the product or build new features and functionality on top of it. You need to spend time to set it up and running.
The limited version of a Proprietary Dashboard Software is a good way to see if it will be useful to your business before making a big investment but these software comes with limitations. A free limited version from a proprietary product company will make it easier to upgrade in the long run and also help you determine if that company’s solution is what you want.
There are also drawbacks to Free Limited version of a Proprietary Dashboard Software . These limited version do not have nearly as many features available in a fully functional paid version, and there are limits such as number of dashboards, storage limits, number of reports, limited data integration options, and also on the number of users you can have. The free versions also have limited support options.
You may like to read: What is Dashboard Software?, Top Dashboard Software , and Open Source, Free and Top Dashboard Software
How to choose the right Dashboard Software?
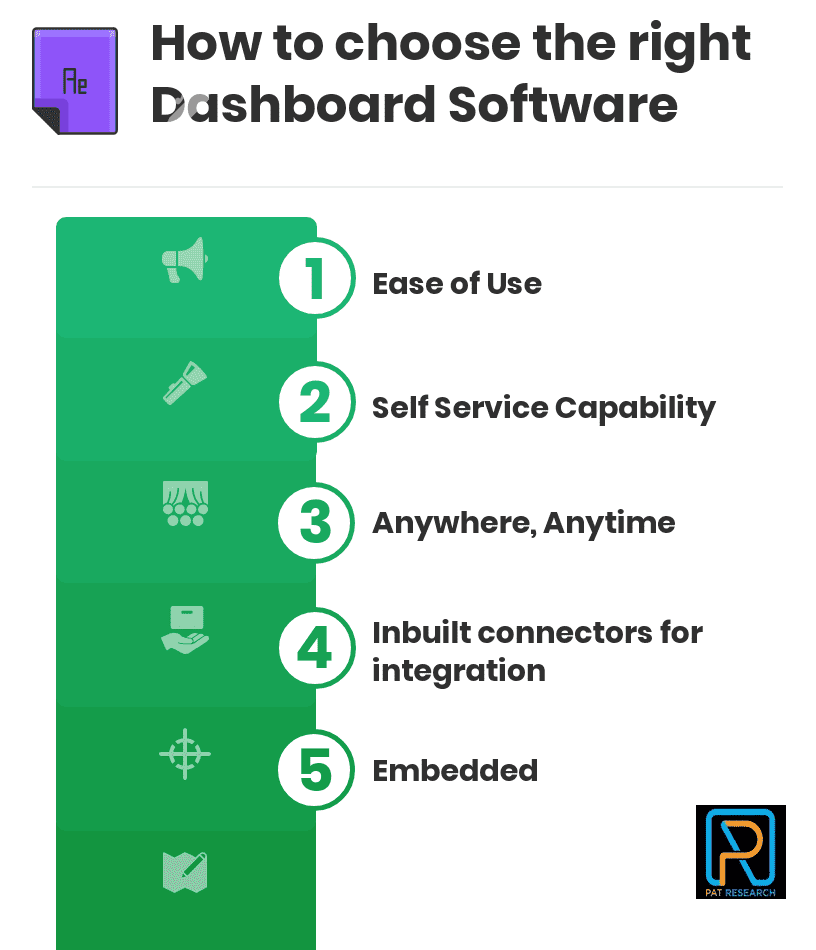
Dashboards are graphic interface that presents data visually. One of the most important thing to think about when buying a Dashboard Software is ease of use, simplicity, visual representation and self service capabilities.
- Ease of Use : Think about understandability of end-users and the tools could be easy to use for the business users.
- Self Service Capability : Provides Self Service capability for business users to perform queries and generate reports on their own, with nominal IT support. Simple to use BI tools with basic analytic capabilities.
- Anywhere, Anytime : Available in all devices from anywhere.
- Inbuilt connectors for integration : Provide a wide variety of pre built connectors to integrate with different systems.
- Embedded : Should be able to embed the dashboards in different applications.
How to choose the right Dashboard Software
Top Free Proprietary and Open Source Dashboard Software


Top Dashboard Software


You may like to read: How to Select the Best Dashboard Software for Your Business, Top Best Practices in Dashboard Software, Top Chart Builder Software
You may also like to read, Top Business Intelligence companies , Top Open Source and Free Business Intelligence Software , Cloud – SaaS – OnDemand Business Intelligence Solutions , Top Free Extract, Transform, and Load, ETL Software , Freemium Cloud Business Intelligence Solutions , Top Embedded Analytics Business Intelligence Software , Top Dashboard Software , Top Enterprise Performance Management Software ,Top Data Visualization Software,Top Business Intelligence Tools,Top Supply Chain Analytics Software,Top Conjoint Analysis Software,Top Unified Modeling Language (UML) Tools ,Top Mobile Business Intelligence Software ,Top Balanced Scorecard Software , Top Advertising Analytics Software and Top Business Process Management Software .
What is Dashboard Software?
Dashboard provide at-a-glance views of Key Performance Indicators (KPI) and integrates data from a variety of sources and provides a unified display of relevant contextual information. Unlike reports, which tend to contain a fixed amount of information, dashboards have the ability to deliver real time or near real time information on demand, as needed by the dashboard user. Dashboards help organizing historical information in the hands of business analysts and executives by using the data found in relational databases, data warehouses and data marts to generate at a glance view that informs executives and senior departmental managers of strategic, tactical and operational trends and opportunities.
What are the Benefits of Dashboard Software?
Dashboard is the heartbeat of decision making. It makes the data visible and provide insights so that the end users can use those information for their benefits. With Dashboard, you can see your profits, your sales revenue, your costs and operational efficiency. But most importantly, you can dig into the data to discover how those numbers came to be.
Is a Free Dashboard Software Worthwhile?
Dashboard Software has many features and can do a lot to help your business to succeed by tracking your Key Performance Indicators, but it can be expensive. There are plenty of free Dashboard Software available. There are two category of Free Dashboard Software Software : Free Open Source Dashboard Software and Limited version of a Proprietary Dashboard Software. Free Open Source Dashboard Software is a good choice, when you have a development team available in your company and when you want to try out the product or build new features and functionality on top of it.
How to choose the right Dashboard Software?
Dashboards are graphic interface that presents data visually. One of the most important thing to think about when buying a Dashboard Software is ease of use, simplicity, visual representation and self service capabilities.


ADDITIONAL INFORMATION
Very informative post, thanks for sharing. There are so many benefits of using business software such as;
It enhanced visibility
Timesaving efficiency
Better forecasting
Key performance indicators
Inventory control