Sign in to see all reviews and comparisons. It's Free!
By clicking Sign In with Social Media, you agree to let PAT RESEARCH store, use and/or disclose your Social Media profile and email address in accordance with the PAT RESEARCH Privacy Policy and agree to the Terms of Use.
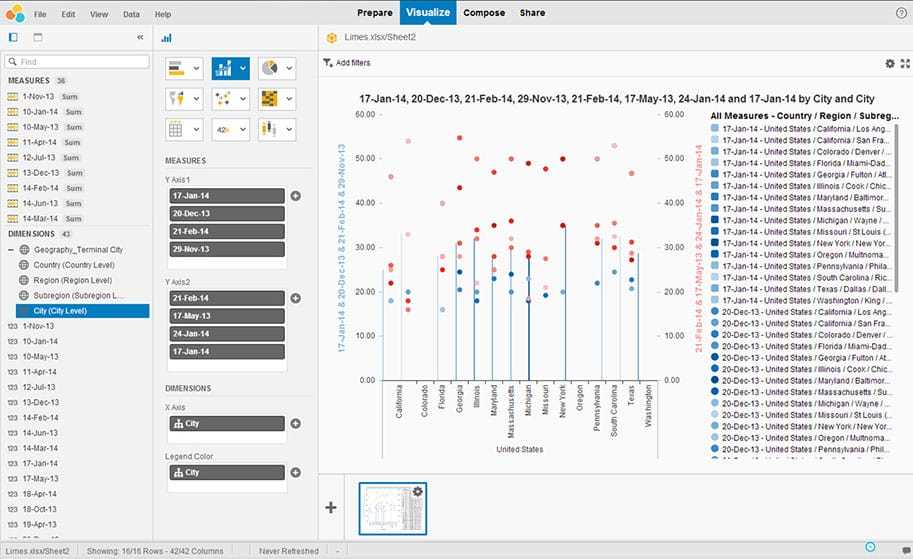
SAP Lumira software helps to bring together and transform large and small data to discover hidden insights and answers.
Category
Data Preparation Software, Data Visualization Software, Dashboard Software
Features
• Connects To Any Data Set • Uncover Hidden Trends • Slice It. Dice It. Visualize It. • Create Your Own Story
License
Proprietary Software
Price
• SAP Lumira, standard edition - USD 185.00 per user
Pricing
Subscription
Free Trial
Available
Users Size
Small (<50 employees), Medium (50 to 1000 Enterprise (>1001 employees)
Company
SAP
What is best?
• Create beautiful and interactive maps, charts, and infographics • Import data from Excel and many other sources • Perform visual BI analysis using intuitive dashboards • Securely share insights and data stories with your team
What are the benefits?
• Manipulate and transform data with ease • Connect to your data big and small • Combine visualizations into storyboards • Access and share insights securely • Acquire data from multiple sources
PAT Rating™
Editor Rating
Aggregated User Rating
Rate Here
Ease of use
8.8
6.8
Features & Functionality
9.0
7.6
Advanced Features
8.9
8.1
Integration
8.8
8.2
Performance
9.0
7.8
Customer Support
8.9
8.2
Implementation
8.1
Renew & Recommend
8.1
Bottom Line
SAP Lumira is designed for ease of use, the software combines fast data manipulation with engaging visualizations, allowing to combine and analyze data from a variety of enterprise and personal sources.
8.9
Editor Rating
7.9
Aggregated User Rating
8 ratings
You have rated this
SAP Lumira
SAP Lumira is a self service Business Intelligence solution from SAP which allows business users to access, transform, visualize data, analyze the trends, and share insights on the BI platform or in the cloud.
SAP Lumira software combines self-service BI discovery and visualization with interactive dashboards and analytic applications – all in one solution that rapidly promotes insight across the organization.
Deliver faster insights easier, with a simple interface for self-service data visualization, data connectivity, and advanced development tools.Enable IT to manage, govern, and deliver fresh data to business users to uncover hidden insights in real-time and drive decision-making, eliminating the need for shadow IT.Integrate on-premise data discovery, dashboards, and analytic applications with business user access to all analytics across the organization using SAP Analytics Hub.
Lumira gives tolls to share data visualizations and collaborate with colleagues in a very easy way.
Company size
Medium (50 to 1000)
User Role
Super User
User Industry
Health care
Rating
Ease of use7.7
It is very easy to use and expand the intelligence by merging multiple datasets into meaningful visualizations
Features & Functionality8.4
Easy features to gain data knowledge and get the most up-to-date information without any coding
Advanced Features7.4
Tools are there to discover hidden insights by exploring data in real time
Integration8.1
Gives integration to acquire and enrich spreadsheet and enterprise data, connecting to SAP BusinessObjects Universe, SAP HANA, freehand SQL, Hortonworks Sandbox, MapR Sandbox,.
Performance7.5
Performance is good to unify your view of the business by bringing together data from enterprise sources
Training 8.4
Customer Support8.1
Implementation7.9
Renew & Recommend7.7
ADDITIONAL INFORMATION Lumira data visualizations based on newly acquired and cleansed data make business take better informed decesions.
Self-service data visualization tool with a fluid drag-and-drop interface
Company size
Medium (50 to 1000)
User Role
End User
User Industry
Financial services
Rating
Ease of use8.2
Features & Functionality8.1
Advanced Features8.4
Integration8.1
Training 8.1
Customer Support8.1
ADDITIONAL INFORMATION SAP Lumira is a powerful self-service data visualization tool with a fluid drag-and-drop interface that makes it easy to create beautiful and interactive maps, charts, and info graphics. SAP Lumira makes understanding data easy, as it allows users to combine data from multiple sources and create beautiful data visualizations in just a few clicks. Users can cleanse and prepare data – and add measures, calculations, and groupings – all without any scripting. SAP Lumira enables users to visualize and analyse large volumes of data at the speed of thought without sacrificing performance, security, or scale. Users can import data from Excel and many other sources, perform visual BI analysis using intuitive dashboards, and securely share insights and data stories with their team. SAP Lumira enables users to securely share data visualizations, including sending active or saved visualizations as an e-mail attachment or a PDF. SAP Lumira enables users to create strong visual design standards, and makes it easy for users to embed them directly into their reporting and analysis tools.
Combine data, analyze trends and share valuable business intelligence in an engaging and effective way.
Company size
Enterprise (>1001)
User Role
End User
User Industry
Aerospace
Rating
Ease of use8.2
Features & Functionality8.3
Advanced Features8.1
Integration8.2
Performance8.1
Training 8.2
Customer Support8.2
Renew & Recommend8.2
ADDITIONAL INFORMATION Build impactful data presentations. Assess corporate risk, improve IT efficiencies, highlight unique data points. Use enriched content to keep your audience engaged and add visualizations and images with simple drag and drop actions. Analyze your data to the most granular level and uncover complex data relationships.
Visualize data right on your PC and Connect to your data big and small.
Company size
Enterprise (>1001)
User Role
End User
User Industry
Aerospace
Rating
Ease of use8.2
Features & Functionality8.1
Advanced Features8.3
Integration8.2
Implementation8.3
Renew & Recommend8.4
ADDITIONAL INFORMATION SAP Lumira – data visualization software that makes it easy to create beautiful and interactive maps, charts, and infographics. Import data from Excel and many other sources, perform visual BI analysis using intuitive dashboards, and securely share insights and data stories with your team.


Self service data visualization for everyone.
Lumira gives tolls to share data visualizations and collaborate with colleagues in a very easy way.
Medium (50 to 1000)
Super User
Health care
It is very easy to use and expand the intelligence by merging multiple datasets into meaningful visualizations
Easy features to gain data knowledge and get the most up-to-date information without any coding
Tools are there to discover hidden insights by exploring data in real time
Gives integration to acquire and enrich spreadsheet and enterprise data, connecting to SAP BusinessObjects Universe, SAP HANA, freehand SQL, Hortonworks Sandbox, MapR Sandbox,.
Performance is good to unify your view of the business by bringing together data from enterprise sources
ADDITIONAL INFORMATION
Lumira data visualizations based on newly acquired and cleansed data make business take better informed decesions.
Self-service data visualization tool with a fluid drag-and-drop interface
Medium (50 to 1000)
End User
Financial services
ADDITIONAL INFORMATION
SAP Lumira is a powerful self-service data visualization tool with a fluid drag-and-drop interface that makes it easy to create beautiful and interactive maps, charts, and info graphics. SAP Lumira makes understanding data easy, as it allows users to combine data from multiple sources and create beautiful data visualizations in just a few clicks. Users can cleanse and prepare data – and add measures, calculations, and groupings – all without any scripting. SAP Lumira enables users to visualize and analyse large volumes of data at the speed of thought without sacrificing performance, security, or scale. Users can import data from Excel and many other sources, perform visual BI analysis using intuitive dashboards, and securely share insights and data stories with their team. SAP Lumira enables users to securely share data visualizations, including sending active or saved visualizations as an e-mail attachment or a PDF. SAP Lumira enables users to create strong visual design standards, and makes it easy for users to embed them directly into their reporting and analysis tools.
Combine data, analyze trends and share valuable business intelligence in an engaging and effective way.
Enterprise (>1001)
End User
Aerospace
ADDITIONAL INFORMATION
Build impactful data presentations. Assess corporate risk, improve IT efficiencies, highlight unique data points. Use enriched content to keep your audience engaged and add visualizations and images with simple drag and drop actions. Analyze your data to the most granular level and uncover complex data relationships.
Visualize data right on your PC and Connect to your data big and small.
Enterprise (>1001)
End User
Aerospace
ADDITIONAL INFORMATION
SAP Lumira – data visualization software that makes it easy to create beautiful and interactive maps, charts, and infographics. Import data from Excel and many other sources, perform visual BI analysis using intuitive dashboards, and securely share insights and data stories with your team.