Sign in to see all reviews and comparisons. It's Free!
By clicking Sign In with Social Media, you agree to let PAT RESEARCH store, use and/or disclose your Social Media profile and email address in accordance with the PAT RESEARCH Privacy Policy and agree to the Terms of Use.
SAP Crystal Dashboard Design software is used to create insightful dashboards from any data source with point and click ease. With SAP Crystal Dashboard Design, business can create professional dashboards from any type of live company data via the universe semantic layer in SAP Crystal Server software, Web services, or Microsoft Excel spreadsheets.
Category
Business Intelligence Software
Sub Category
Dashboard Software
Features
• Monitor performance across your organization with key performance indicators (KPIs) • Visualize trends and use “what if” analysis to understand the impact of business change • Consolidate reports and live data from multiple sources into a single dashboard • Share dashboard views online or via familiar tools such as Microsoft Office and Adobe PDFs
License
Proprietary Software
Price
• SAP Crystal Dashboard Design 2016 - USD 495.00 per user
Pricing
Subscription
Free Trial
Available
Users Size
Small (<50 employees), Medium (50 to 1000 Enterprise (>1001 employees)
Company
SAP
What is best?
• Transform data into engaging, interactive dashboards • Get a holistic, actionable view of your business with SAP Crystal Dashboard Design • Monitor performance across your organization with key performance indicators (KPIs) • Visualize trends and use “what if” analysis to understand the impact of business change • Consolidate reports and live data from multiple sources into a single dashboard • Share dashboard views online or via familiar tools such as Microsoft Office and Adobe PDFs
What are the benefits?
• Extend the reach of dashboard functionality by integrating dashboard visualization components into IBM WebSphere Portal and Microsoft SharePoint. • Turn dashboards into WebSphere portlets easily – without coding • Provide Microsoft SharePoint users with interactive charts, graphs, and dashboards • Access and deliver business data through desktop applications and widgets • Platform-Independent Export Options
PAT Rating™
Editor Rating
Aggregated User Rating
Rate Here
Ease of use
7.6
6.2
Features & Functionality
7.7
6.9
Advanced Features
7.7
6.7
Integration
7.8
6.4
Performance
7.8
6.3
Customer Support
7.6
7.2
Implementation
6.0
Renew & Recommend
4.6
Bottom Line
SAP Crystal Dashboard Design software is used to create insightful dashboards from any data source with point and click ease. With SAP Crystal Dashboard Design, business can create professional dashboards from any type of live company data via the universe semantic layer in SAP Crystal Server software, Web services, or Microsoft Excel spreadsheets.
7.7
Editor Rating
6.5
Aggregated User Rating
8 ratings
You have rated this
SAP Crystal Dashboard Design software is used to create insightful dashboards from any data source with point and click ease. With SAP Crystal Dashboard Design, business can create professional dashboards from any type of live company data via the universe semantic layer in SAP Crystal Server software, Web services, or Microsoft Excel spreadsheets.
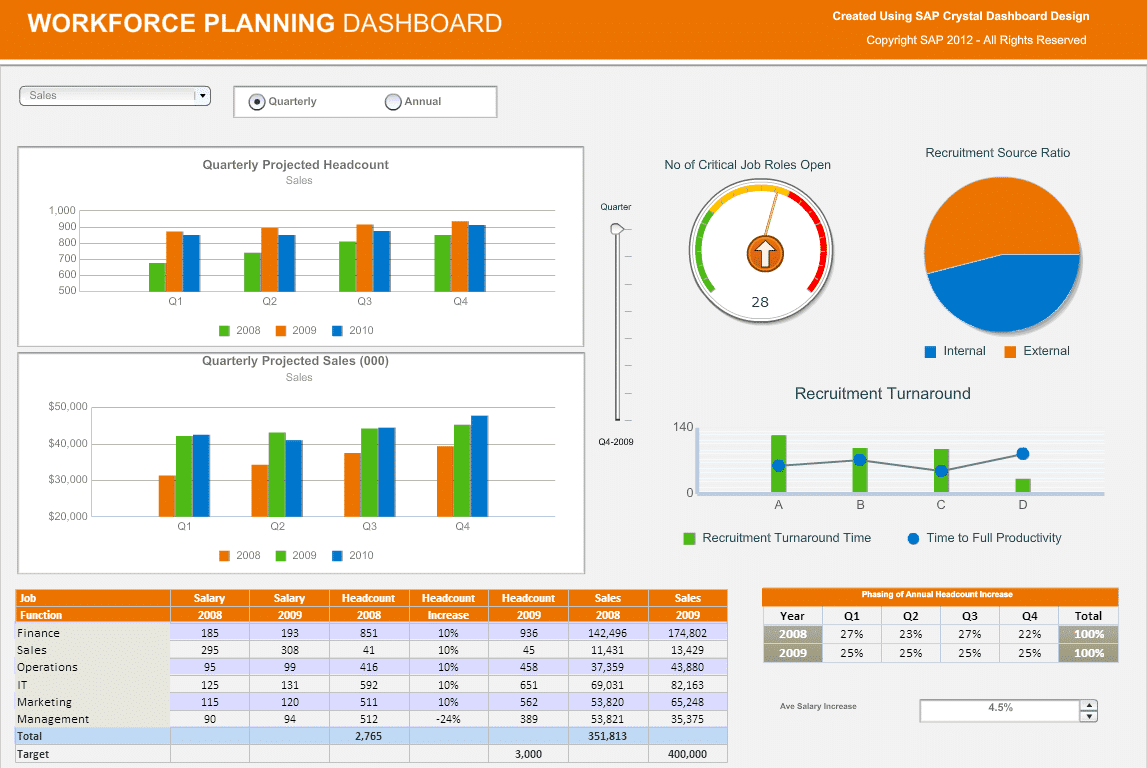
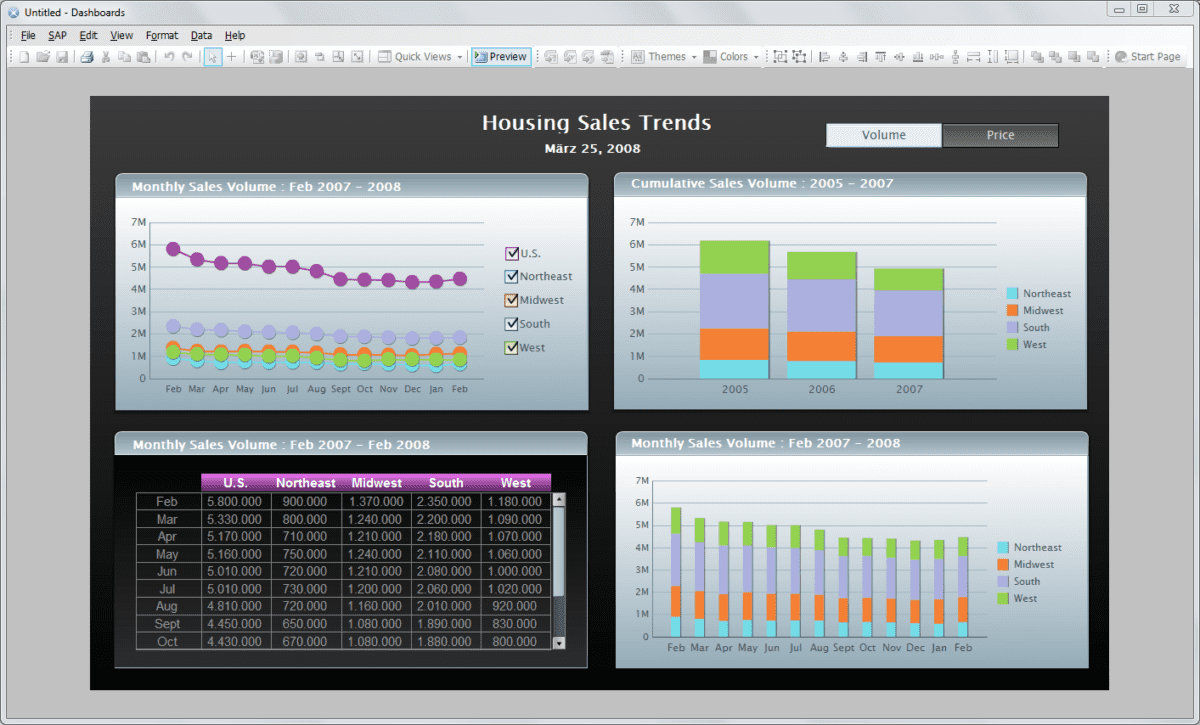
With a feature-rich library of ready-to-use charts, maps, gauges, drill-down charts, and progress bars, plus a point-and-click interface for connecting prebuilt charts and graphics to data, you can create interactive data visualizations based on Adobe Flash and Adobe Flex technologies . SAP Crystal Dashboard Design Turn raw data into sophisticated dashboards that will help you better understand your data and improve your decision making.
Features include develop and deploy sophisticated dashboards in just days, leverage what-if analysis and interactive sliders with your SAP Crystal Reports software and easily connect prebuilt charts and graphics to live company data with the point-and-click interface.
Consolidate multiple reports into a single dashboard, export to Adobe PDF, Flash, AIR, Microsoft PowerPoint and HTML, software development kit and feature-rich library of ready-to-use charts, maps, gauges, drill-down charts, and progress bars for interactive data visualizations.
Empower everyone to transform data into insightful, interactive dashboards and visualizations. Business users can turn any type of live company data into powerful dashboards – without help from IT. Microsoft Excel users can transform spreadsheets into interactive data presentations, in minutes, with SAP Crystal Dashboard Design.
Dashboards from any data source with point and click
What is best?
Information sharing that saves time and money by enabling you to use the tools you already have, such as Microsoft Office applications.
Company size
Small (<50)
User Role
Super User
User Industry
Energy
Rating
Ease of use8
With SAP Crystal Dashboard Design you can create engaging dashboards from any data source with just point and click.
Features & Functionality7.3
Better performance monitoring of key performance indicators (KPIs) and data from multiple sources into a single dashboard.
Advanced Features8.4
Predictive modeling to see trends within the business and perform what-if analyses to understand the impact of proposed changes
Integration7.7
Data consolidation from multiple sources and presentation in a dashboard that offers easy-to-consume visualizations, such as charts, graphs, maps, and gauges
Transform data into engaging and interactive dashboards by use of holistic and actionable view of your business.
Company size
Small (<50)
User Role
End User
User Industry
Construction
Rating
Ease of use8.1
Features & Functionality8.2
Advanced Features8.3
Customer Support8.1
Implementation8.3
Renew & Recommend8.3
ADDITIONAL INFORMATION Sap crystal dashboard design – monitors performance across your organization with key performance indicators. Visualize trends and use “what if” analysis to understand the impact of business change. Consolidate reports and live data from multiple sources into a single dashboard. Share dashboard views online or via familiar tools such as Microsoft Office and Adobe PDFs.


Dashboards from any data source with point and click
Information sharing that saves time and money by enabling you to use the tools you already have, such as Microsoft Office applications.
Small (<50)
Super User
Energy
With SAP Crystal Dashboard Design you can create engaging dashboards from any data source with just point and click.
Better performance monitoring of key performance indicators (KPIs) and data from multiple sources into a single dashboard.
Predictive modeling to see trends within the business and perform what-if analyses to understand the impact of proposed changes
Data consolidation from multiple sources and presentation in a dashboard that offers easy-to-consume visualizations, such as charts, graphs, maps, and gauges
Perofmrance is Ok.
The trainings are priced high.
Support is average with the tier approach.
ADDITIONAL INFORMATION
Overall easy to use.
Transform data into engaging and interactive dashboards by use of holistic and actionable view of your business.
Small (<50)
End User
Construction
ADDITIONAL INFORMATION
Sap crystal dashboard design – monitors performance across your organization with key performance indicators. Visualize trends and use “what if” analysis to understand the impact of business change. Consolidate reports and live data from multiple sources into a single dashboard. Share dashboard views online or via familiar tools such as Microsoft Office and Adobe PDFs.