
Top 12 Best Practices in Dashboard Software

Management needs to track KPIs, metrics and any other data that is relevant to the business, department or a specific process. This is done by use of business intelligence dashboard software. Dashboard software is a platform that is designed to offer a visual representation of an organization’s real-time performance. For an easy understanding, this can be equated to a car’s dashboard.
They enable business leaders to visualize the performance of an organization at a glance. The most critical element of your business intelligence delivery is data visualization and data discovery. So it goes without saying that you should have it right from the word go.
Business Intelligence Dashboard Software is an application that has been designed to provide information at a glance through the use of data visualization. It assists the organization to have a sneak view of their key performance indicators relevant to a specific department or business process. By simplifying complex data set, the users are able to capture important business insights at a glance. An organization can also use Business intelligence dashboard to define metrics, set performance goals as well as identify problems.
You may like to read: Top Guidelines for a Successful Business Intelligence Strategy
What are Dashboard Software?
For a business to thrive, valuable decisions have to be made. These decisions are normally based on numbers and analysis offered. This is where business intelligence software comes in handy. It provides valuable information to business leaders which in turn help them in performing an accurate business analysis.
Dashboard software is a type of business intelligence tool that provides real-time data visualization and analysis capabilities. It presents key metrics, KPIs, and other important data in a graphical format, allowing users to quickly understand complex information and make informed decisions.
What are Dashboard Software
Dashboards can be customized to meet the specific needs of an organization, and often include interactive elements such as charts, graphs, and drill-down options. The software is used to monitor business performance, identify trends, and track progress towards goals. With dashboard software, organizations can gain a comprehensive view of their operations, making it easier to optimize processes and drive business success.
Normally, dashboards are used by senior managers, chief executives or business leaders to monitor what is happening within an organization as well as make quick fixes whenever there is a looming problem. But this doesn’t mean dashboard is only a preserve of the executives. It can as well be utilized at any level of your business. Employees from all levels of their job position need to monitor and measure valuable performance metrics related to the goals of the company as well as measure key performance indicators.
Dashboard Types
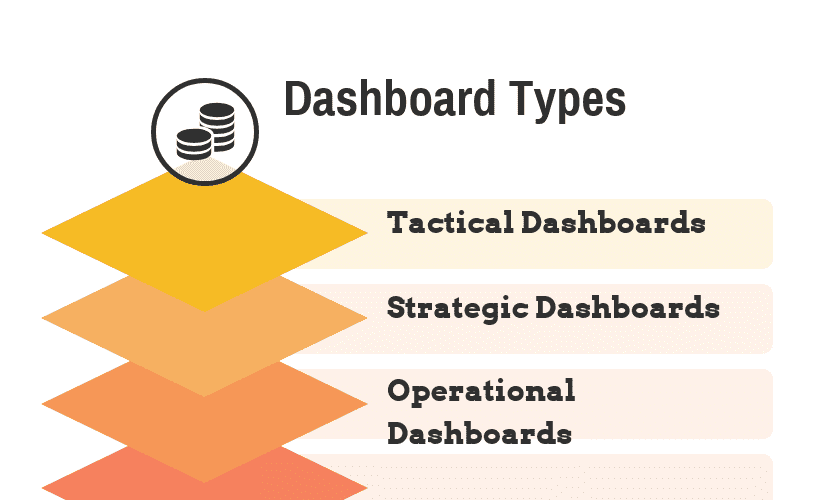
The business dashboard comes in three general categories depending on their use. These are;
- Tactical dashboards: they are normally used by the managers as they seek a deeper understanding of a company’s action.
- Strategic dashboards: senior executives use this to monitor the progress of a company towards achieving the set strategic goals.
- Operational dashboards: for a smooth and efficient operation of an organization, different departments’ makes use of operational dashboards to perform their daily activities.
For a business to reap maximum benefit, it’s imperative for the users to learn how to use the dashboard properly in order to get positive results.
You may like to read: Open Source, Free and Top Dashboard Software
Top 12 Best Practices in Dashboard Software
Data is one of the components that are always predominant in any organization. Most of the information is relayed in form of data. This means you cannot run away from data whether you are an expert or not. The secret to dealing with this nightmare is having a well-designed dashboard.
Why is it so? A dashboard can be used by everybody regardless of whether you are a tech-savvy or not to make informed business decisions. It’s worth noting that a poorly designed dashboard will not convey the right information. It can even lead to poor decision making.
What constitutes a good business intelligent dashboard?
- It should be able to convert complex data into simple information.
- It should be able to answer the viewers question in a clear manner while giving a clear meaning of the data collected.
- It should also reveal details as per the viewers’ needs without revealing too much or too little information.
Here are some of the design tips to keep in mind.
- Have your audience in mind while designing the dashboard
- Be wary of common data visualization issues such as the use of charts that distort reality
- Use best practices dashboard designs
To build an effective dashboard, here are some of the business practices you ought to know to avoid a disastrous dashboard.
You may like to read: Cloud BI – SaaS BI– OnDemand BI Top Business Intelligence Software
Top Best Practices in Dashboard Software
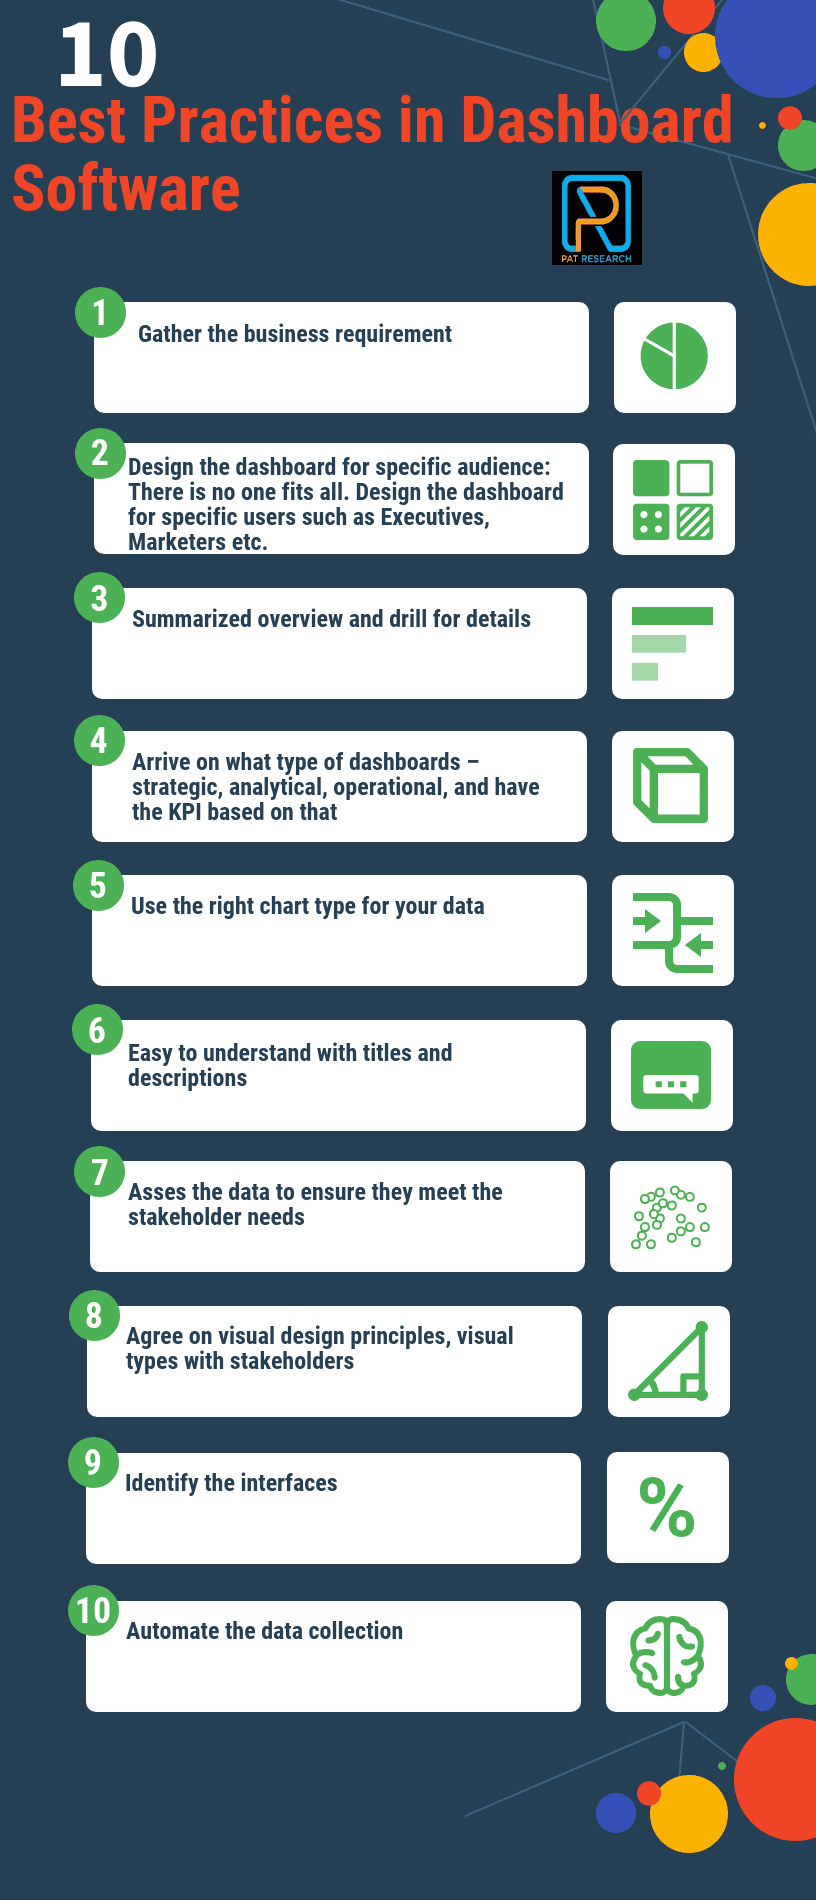
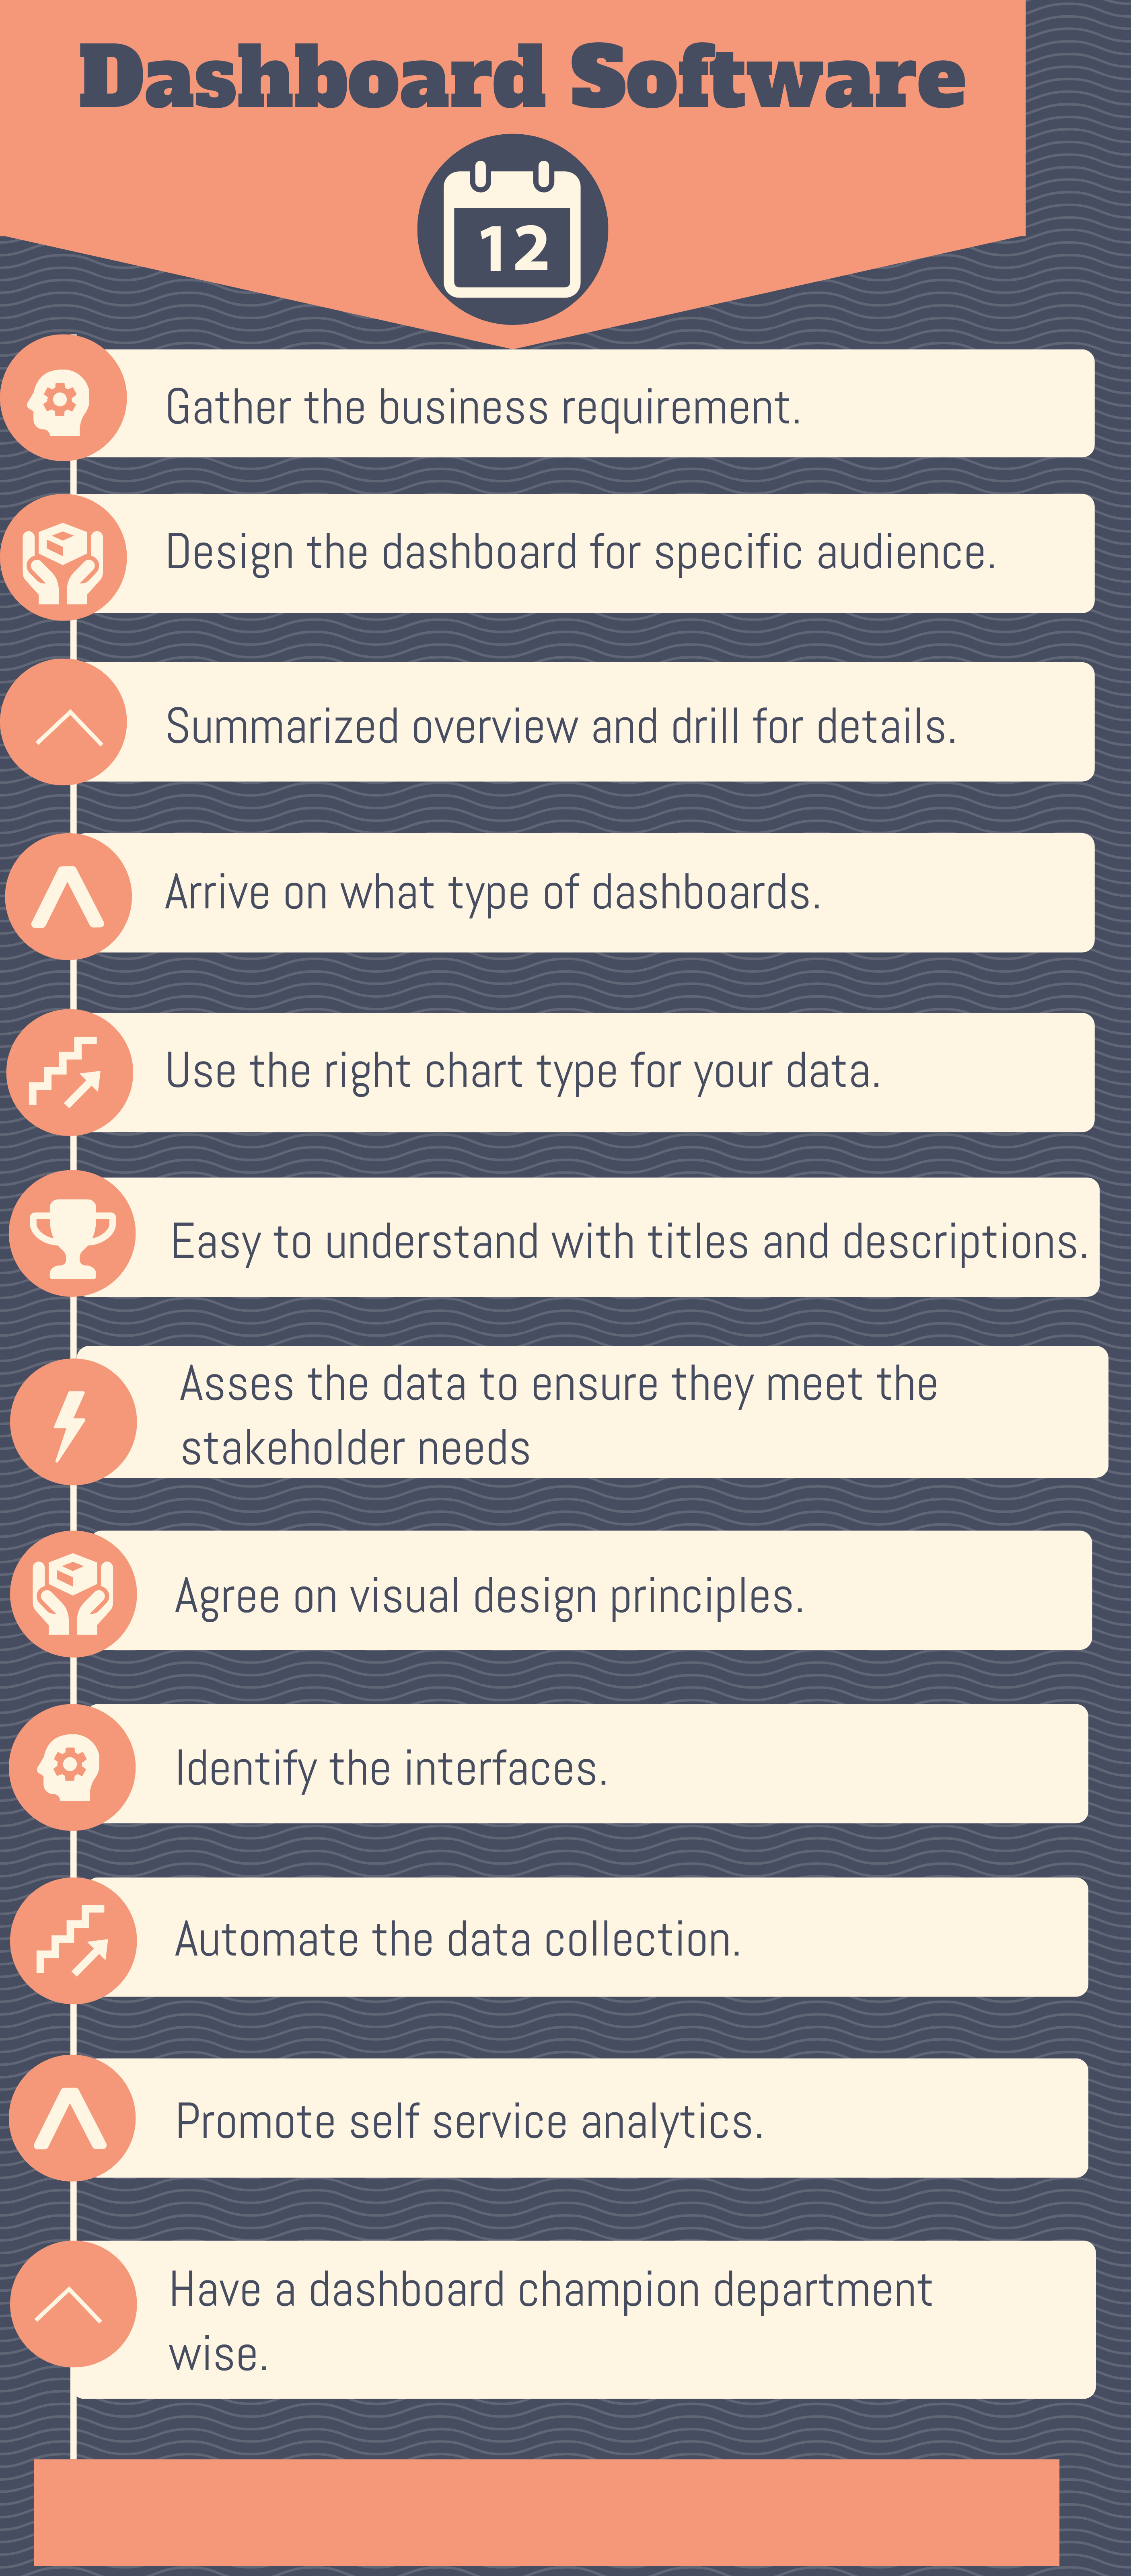
Dashboard Software Best Practices 1 - Gather the business requirement
How do you come up with an effective dashboard? First, you need to identify the problem you want to solve. Gather enough information on what the business requires and how you are going to provide that information.
Once this data is available, of what benefit will it be to the company and what is the target group for this data. Is it meant for executive, senior level management or for normal business operation?
Dashboard Software Best Practices 2 - Design the dashboard for specific audience: There is no one fits all. Design the dashboard for specific users such as Executives, Marketers etc
Have your audience in mind while designing your dashboard. In an ‘ideal’ business, information flows from the bottom tier of the management to the senior level. This means the lower tier managers report is more detailed as it tends to deal with the day to day information from their respective staff. This is not the case with an executive who only needs to know if the marketing department has hit its target.
Present your report in a pyramid structure to match the management structure. As you go up the ladder, remove the unnecessary information to avoid information overload and failure to take responsibility by the lower level managers.
You may like to read: Business Intelligence Tools and the Types of Business Intelligence Software
Dashboard Software Best Practices 3 - Summarized overview and drill for details
Once you have designed the dashboard for specific audience, now it’s time to display information in a summarized report giving an overview of what is happening in the organization. Remember your dashboard is meant to give an overview that answers a need or a question.
When the user’s needs detailed information on how the profit rose, which cost center is underutilized, and what can be done differently, they can use the drill down or drill through for more details.
Dashboard Software Best Practices 4 - Arrive on what type of dashboards – strategic, analytical, operational, and have the KPI based on that
Ideally, you should have a small number of KPIs for the different functions of your dashboard. What is the message you want to relay to your strategic, operational or analytical team? The KPIs that you settle for should be able to answer the following three questions;
- Are things ok?
- Are things looking good?
- Are things looking bad?
Your KPIs will only be useful if you are able to tell the kind of action you should take when the dashboard tells you whether something is good or bad.
Dashboard Software Best Practices 5 - Use the right chart type for your data
The information you want to be displayed in your data determines the kind of chart to use. If you want to compare the values of each category side by side, column charts would be a good match.
On the other hand, if your intention is to show the relation of one category to the entire value use pie charts. The type of metric you have and the message you want to relay should dictate the kind of a chart to use.
Dashboard Software Best Practices 6 - Easy to understand with titles and descriptions
Add context to your data to help the user understand the true meaning of the results and what kind of action is required. How you label your metrics should make sense to the other users. Even if the metrics are pretty obvious and familiar to you always ensure they are validated. Your audience should be able to decipher the meaning of your metrics. This can be done by offering clear descriptions and appropriate titles.
You may like to read: What is Dashboard Software?, Top Dashboard Software , and Open Source, Free and Top Dashboard Software
Dashboard Software Best Practices 7 - Asses the data to ensure they meet the stakeholder needs
Data captured should be relevant to your stakeholder’s needs. For example, if the dashboard is intended for the executives, capturing information that is irrelevant or that’s meant for managers may end up confusing the executive thus resulting in a poor adoption of the dashboard.
If it is meant for the marketers, don’t give information that shows how finance functions are being met. Instead, provide information that will help them determine how the marketing return on investment is doing.
You may like to read: Open Source, Free and Top Dashboard Software
Dashboard Software Best Practices 8 - Agree on visual design principles, visual types with stakeholders
Stakeholders might have their preferred way of displaying data which could be different from what you prefer. Do they prefer numerical data to charts and analytical visuals? Always have the user in mind when developing your reports.
Dashboard Software Best Practices 9 - Identify the interfaces
You need to identify how the information will be exchanged between the different software and users in the organization. Once this is done, it will be easier to automate the data collection as different users can interact with the system comfortably.
You may like to read: Top Best Practices in Data Visualization
Dashboard Software Best Practices 10 - Automate the data collection
Always ensure the data that is being fed into visualization is reliable, otherwise, the dashboard will turn out to be useless. You can connect your data sources to your dashboard through integrations. You can also upload an excel file directly.
Dashboard Software Best Practices 11 - Promote self service analytics
Users should be able to share new information obtained from the detailed data with others. This helps the business to put the new knowledge into business action. How can this information be shared?
- Information can be sent to pertinent and affected stakeholders either through the BI platform or email.
- Reports can be enhanced with comments and contextual knowledge and then shared through discussion threads and respective users notified
- A dashboard should have a web-based platform whereby external stakeholders are able to access the reports and act on the issues raised
You may like to read: Why Small Businesses Need Business Intelligence Software
Dashboard Software Best Practices 12 - Have a dashboard champion department wise
For purpose of accountability, each department should have a champion who oversees the operation of the dashboard. The champions should be given the mandate to operate and oversee full implementation of the dashboard in their own departments. They also come in handy when it comes to ascertaining data integrity and reports.
In conclusion, dashboard software is a valuable tool for organizations looking to improve their business intelligence capabilities. By presenting data in a graphical and easy-to-understand format, dashboards provide real-time insights and make it easier for decision-makers to understand complex information. The ability to customize dashboards to meet specific needs, and the inclusion of interactive elements such as charts and graphs, allows organizations to monitor business performance and track progress towards goals. Dashboard software enables organizations to make data-driven decisions, optimize processes, and drive business success. In today's fast-paced business environment, dashboard software is a must-have tool for organizations looking to stay ahead of the competition.
Here are the trending and the top rated Dashboard Software for you to consider in your selection process:


You may like to read: How to Select the Best Dashboard Software for Your Business, Top Best Practices in Dashboard Software, Top Chart Builder Software
Here are the trending and the top rated Dashboard Software Free for you to consider in your selection process:


What are Dashboard Software?
Dashboard Software is a business intelligence application that has been designed to provide information at a glance through the use of data visualization. It helps the organization to have a sneak view of their key performance indicators relevant to a specific department or business process in a dashboard.
What are the types of Dashboards?
Dashboard comes in three general categories: Tactical Dashboards, Strategic Dashboards and Operational Dashboards
What makes a good Business Intelligence Dashboard?
A good Dashboard should be able to convert complex data into simple information and should be able to answer the viewers question in a clear manner while giving a clear meaning of the data collected. It should also reveal details as per the viewers’ needs without revealing too much or too little information.
How can we make Dashboards better?
Have your audience in mind while designing the dashboard. Be wary of common data visualization issues such as the use of charts that distort reality and use best practices dashboard designs.
What are the Dashboard Software Best Practices?
Dashboard Software Best Practices include properly gathering the business requirement, design the dashboard for specific audience such as business users, executives, provide a summarized overview and drill for details, arrive on what type of dashboards – strategic, analytical, operational, and have the KPI based on that and many more.
You may also like to read, Top Business Intelligence companies , Top Open Source and Free Business Intelligence Software , Cloud – SaaS – OnDemand Business Intelligence Solutions , Top Free Extract, Transform, and Load, ETL Software , Freemium Cloud Business Intelligence Solutions , Top Embedded Analytics Business Intelligence Software , Top Dashboard Software , Top Enterprise Performance Management Software ,Top Data Visualization Software,Top Business Intelligence Tools,Top Supply Chain Analytics Software,Top Conjoint Analysis Software,Top Unified Modeling Language (UML) Tools ,Top Mobile Business Intelligence Software ,Top Balanced Scorecard Software , Top Advertising Analytics Software and Top Business Process Management Software .


 Objectives and Benefits")


By clicking Sign In with Social Media, you agree to let PAT RESEARCH store, use and/or disclose your Social Media profile and email address in accordance with the PAT RESEARCH Privacy Policy and agree to the Terms of Use.