
28 Free, Open Source and Top Flowchart Software

Business operations and projects involve complex processes and procedures. There is a need to understand each one of them to comprehend how efforts are being directed towards achieving organisational objectives.
One may need to spend some time analysing reports and plans to follow things such as the progress and overall direction of the business. Locally, flowcharts have been introduced into the scene, and they make it a lot easier to apprehend such processes, sometimes by just one glance.
When business operations, plans and even project activities are represented in flow charts, it is easier to keep track of your team. You can get a good view of the general direction of your business, and this will make it easier to make decisions that steer your firm into the path to its strategic goal. Therefore, incorporating flowchart software into your company’s system(s) will go a long way in controlling and evaluating your business’s progress.
Flowchart is a type of diagram that represents an algorithm, workflow or process, showing the steps as boxes of various kinds, and their order by connecting them with arrows.
Flowcharts are used in analyzing, designing, documenting or managing a process or program in various fields. Document flowcharts, showing controls over a document-flow through a system, Data flowcharts, showing controls over a data-flow in a system, System flowcharts, showing controls at a physical or resource level and Program flowchart, showing the controls in a program within a system are some of the different types of flowcharts. Flowchart promote understanding of a process by explaining the steps pictorially.
Flowchart can help you gain agreement about the sequence of steps with the different stakeholders. Flowchart provide a tool for training employees as it can help employees to perform the process according to standardized procedures. Flowchart also helps to identify problem areas and opportunities for process improvement. Once you break down the process steps and diagram them, problem areas become more visible and it makes it easy to spot opportunities for simplifying and refining your process.
What are the Top Free Flowchart Software: Adobe Spark, Canva, Visme, Edraw Mind Map, yEd, Flowgorithm, Dia, FreeMind, Plantuml, VisiRule, RAPTOR, Visual Logic, ClickCharts, Inkscape, LARP, ThinkComposer, LibreOffice Draw, Diagram Designer, Draw, Pencil are some of the Flowchart Software.
What are the Top Flowchart Software: Visio, Adobe Spark, Canva, Visme, Creately, Lucidchart, Gliffy, SmartDraw, ConceptDraw MINDMAP, Grapholite, iGrafx FlowCharter, Cacoo are some of the Flowchart Software.
You may want to review How to Select the Best Flowchart Software for Your Business
What is Flowchart Software?
Flowchart Software is used to draw diagram of type flowchart which is made of boxes and arrows. Flowchart Software are used in designing and documenting simple processes or programs. Flowchart Software help to visualize what is going on and help to understand a process,. It is also used to find flaws, bottlenecks, and other less-obvious features within it.
Some of the common flowchart types include Swimlane flowcharts, Data flow diagrams, Influence diagrams, Workflow diagrams and Process flow diagrams. Flowchart Software aligns everything automatically so you don't have to worry about formatting, rearranging, or reconnecting steps. It also provides themes and high quality symbols for presentation quality every time.
A flowchart is a formal representation (graphical) of processes, plans, steps, sequences and activities that need to be carried out in that order to achieve a specific outcome. They represent workflow in simple terms that are easy to comprehend by users. These processes are shown in geometric symbols such as circles, boxes and diamonds, and arrows represent the relationship between the sequences.
Flowchart software generates such diagrammatic representations automatically; it only needs to be fed information which it can obtain from data warehouses and databases. Mechanical engineers initially used flowcharts, but they quickly gained popularity and found their use in almost every other field to manage projects. Today there are many types, ranging from document to program flowcharts. The kind of flowchart software that will be suitable for your business will largely depend on the type of data to be represented and also the users of the data.
What is Flowchart Software?
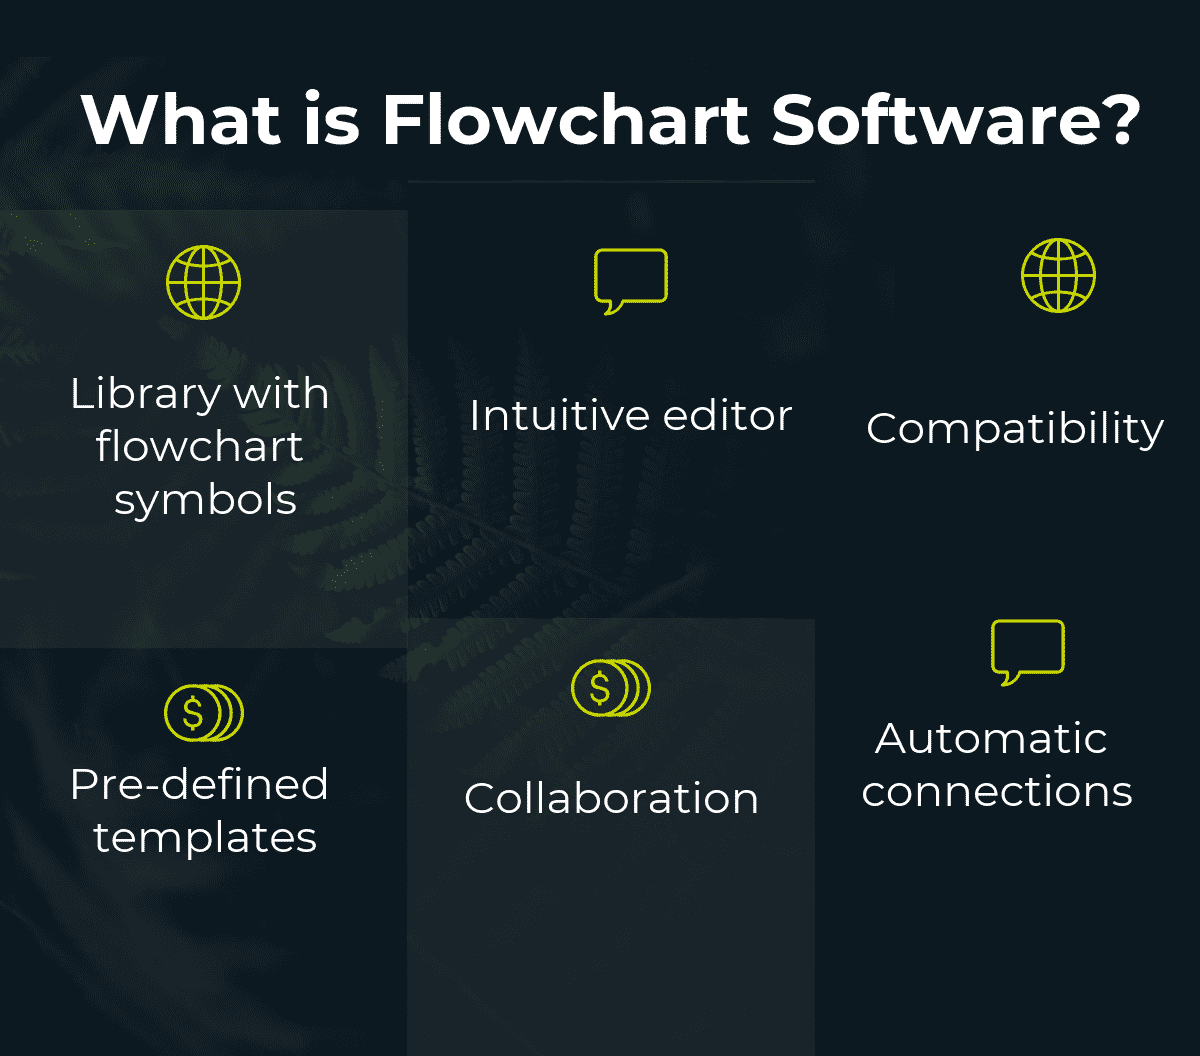
Standard features of flowchart software include:
- Library with flowchart symbols: Different types of flowcharts require different sets of symbols to represent data. Typically, the software comes with different sets of symbols that you can employ to suit the different purposes of your flowcharts.
- Intuitive editor: Flowchart software it normally easy to use and understand. It comes with a user-friendly interface (this may depend on which editor you are using, but generally, they are formally appealing.)
- Pre-defined templates: The software comes with pre-drawn templates for basic flowcharts such as organisational charts, human resource charts and even programming flowcharts. All you need to do is enter the data and customise a few more things to suit your particular function.
- Automatic connections: Drawing is easy, and there is no need for any artistic skills. The flowchart software automatically aligns, spaces and connects your symbols to look neat and professional.
- Compatibility: To make sure that you do not have to do the same work twice, flowchart software is designed to be compatible with other platforms such as Word, Excel and PowerPoint. This makes it easy to import and export flowcharts into such programs.
- Collaboration: Flowchart software makes it easy to share the files with other parties, and you can also convert them to other formats such as PDF which can easily be shared or attached to presentations and websites
Top Flowchart Software
You may want to review How to Select the Best Flowchart Software for Your Business


Visio
Visio is a one-stop diagramming solution to simplify and communicate complex information. Visio helps the user work visually and produce diagram effortlessly.Visio simplify and communicate complex information with data-linked diagrams that you can create in just a few clicks. It does simplify and communicate complex information with data-linked diagrams that create in just a few clicks. Whether you want to quickly capture a flowchart that you brainstormed on a whiteboard, map an IT network, build an organizational chart, document a business process, or draw a floor plan. It brings diagrams to life with data linking. The user can connect data…
Adobe Spark
Adobe Spark is a suite of design tools that allow users to make posters, videos and web pages using a computer or iOS mobile device. Adobe Spark simplifies content creation to a level that anyone can master on the first day. Adobe Spark’s flyer maker helps your flyers look professional while keeping the design process quick and easy. Flyer design is important, and images speak for themselves and can go a long way toward communicating tone and feel. Spark flyer maker users can better promote their cause with easily shareable content that is sure to inspire. Spark Post lets users…
• Beautiful typography: Choose from a variety of free professionally designed fonts and for every occasion
• Professional themes: Wide variety of best-in-class layouts, colors, and fonts
• Iconic imagery: Select from thousands of photos on the web or pick from your personal collections on Adobe Creative Cloud, Lightroom CC, Dropbox or Google Photos
• Quick font searching: Filter fonts using classifications such as handwritten or serif
• Styles include also-editable filter-like effects to images that match each typeface, text box style, etc
• Texture & Transparency Editor
• Iconic imagery: Select from thousands of photos on the web or pick from your personal collections on Adobe Creative Cloud, Lightroom CC, Dropbox or Google Photos
• Quick font searching: Filter fonts using classifications such as handwritten or serif
• Styles include also-editable filter-like effects to images that match each typeface, text box style, etc
• Make an impact: Watch published creations make an impact as they receive views and likes from your audiences
• Mobile and web: Projects are automatically synced across the web or the iOS apps
• Fine-tune: Add or change textures, play with color and arrangement, blend, and adjust transparency
Canva
Canva is a user-friendly, reliable and simple design platform for businesses, organizations, and even individual professionals which enables them to create amazing and professional quality graphic designs. Canva offers features such as photo straightener, image cropper, add text to photos, speech bubble maker, image transparency tool, photo enhancer, 8,000 templates, photo blur, photo vignette, design grids, free icons, photo frames, web wireframe, stickers, badges and add texture. Canva has a powerful drag and drop editor with its vast selection of images, fonts, and templates which makes it easy for users to build documents and designs from scratch. Canva lets users…
• Two folders to organize designs
• Up to 10 team members for free
• 1GB storage for photos and assets
• Access to over 8,000 templates
• Upload your own images
• Access millions of photos for $1 each
• Magically resize your designs
• Upload custom fonts for your brand
• Set color palettes for your brand
• Save templates for you and your team
• Organize your photos with folders
• Easily find your designs with search
• Priority support
• Canva - Free forever
• Canva for Work - $12.95 per user per month
• Canva Enterprise – Contact on site
• Two folders to organize designs
• Up to 10 team members for free
• 1GB storage for photos and assets
Visme
Visme is an infographic software that provides simple and intuitive solutions that will transform the way you communicate visually. Visme enables you to create infographics in three simple steps, which are quick start, visualising your information, and editing and customising your infographic. In the first step, Visme provides you with an excellent platform for tapping into their professional templates as well as allowing you to create your own custom layout for your infographic. Visme provides hundreds of beautiful templates, designed infographics, and report templates. With, Visme you have an excellent platform for creating your own layout by allowing you to…
• Graphs and tables
• Maps and data widgets
• Images and icon
• Use ‘smart’ shapes and lines that stretch to fit your design needs • Create pictographs that use icons to visualize bar chart segments
• Generate icons arrays to visualise segments of a population
• Create professional tables and customize
Creately
Creately is a beautiful and easy diagramming and collaboration tool that enables teams to create flowcharts, UML, UI Mock-ups and much more. It comes with a full-featured Desktop App through which users can work fully offline and collaborate online. Users can work with 2 or 20 other people from across the world sharing projects and enjoying secure publishing. Creately has 1000 ready-made templates, extensive shape libraries and 100,000 examples. One of its finest features is “1-click create” with which users can draw the shape and the line connecting it with 1 click. Users can also choose from 100s of expertly…
Easy to draw
Smart Shapes & Connectors
Collaborate with anyone
Thousands of templates
Online, Desktop or Server
For Individual Use: $5 per month/ $49 per year
5 Users: $25 per month/ $249 per year
10 Users: $45 per month/ $449 per year
25 Users: $75 per month/ $749 per year
For individual use with limitations: Free (for 5 public diagrams)
Lucidchart
Lucidchart provides an intuitive and collaborative diagramming solution for the company’s entire organization. It focuses on quality, security, and affordability which make the decision making easier. Lucidchart’s simple admin interface makes it easy to configure permissions and auto-provision new accounts. Users can even move all other users onto a single master account to simplify document management. That way, important documents won’t leave when their creators do.Lucidchart is secure and reliable. It provide options to limit sharing by domain and to require SSO authentication via Google, OneLogin, Okta, or Ping, admins don’t have to wonder about security. Meanwhile, all docs are…
•Data Encryption
•Robust Backup
•Secure Data Centers
•Embedded Documents
•Drag and Drop Functions
•Dedicated Support Team
•Basic $4 .95/mo
•Pro $8 .95/mo
•Team $20/mo
• Easy from the start
• Built for collaboration
• Secure and dependable
Gliffy
Gliffy.com is a web-based diagram editor. It creates and shares flowcharts, network diagrams, floorplans, user interface designs, and another kind of diagram using the Gliffy diagram tool is the first step to turning the idea into a reality. Gliffy makes it possible to work with anyone anywhere without worrying about software or browser compatibility. The SaaS is supported in all modern web browsers, including Google Chrome, Firefox, Safari, and Internet Explorer 9+. Gliffy online runs on an HTML5 editor that’s more than twice as fast as Flash. It creates and edits even very large diagrams without wasting time. Gliffy features…
Easy to use.
Collaborate with anyone.
Use templates and themes.
Protect and track changes.
Extensive Shape Library.
Pricing starts from $3.99/month. Freemium, and subscription model.
Discounted rate is available. Free trial available. Contact Gliffy for pricing.
SmartDraw
SmartDraw is easy to use, fast, cost effective drawing tool .SmartDraw is accessible via the web and mobile devices. SmartDraw is Effective, because it's a living, electronic document that is easy to keep up to date. SmartDraw is designed specifically for process management and documentation. All of the templates and symbols users need are included. SmartDraw gives users simple commands (or keyboard shortcuts) to add shapes, automatically placing them and adding connecting lines. To add text, just click and type. It's so fast, there's no need to take notes and fill in a form later—with SmartDraw one can do it…
• Smart formatting
• Smart templates
• Smart integration
• SmartDraw cloud
• Visio Compatibility
• Standard $ 197
• Business $297
• Enterprise $497
• SmartDraw Works Anywhere
• Rich and Deep Content
• Easy to Use
ConceptDraw MINDMAP
ConceptDraw MindMap software is a professional software made for designing and building time saving mind maps. It comprises of a comprehensive set which can design mind maps that illustrate your thought process. It major features include ability to organize ideas and data with a massive productivity tool that can be maneuver and simple to use. It can also produce large document styles and templates. Your presentations can be produced live and export them to Microsoft power point or websites. It is excellent for project management, planning, brainstorming, management of meetings, note taking and lots more. A lot of brain storm…
• Adding attachments in any format
• Use of Hypernote
• Enables graphic image
• Building technical scheme and diagrams
• Ability to exchange data with Microsoft project,
•Microsoft office, Concept Draw project, Mind manager, XMind and FreeMind.
• Ability to created slideshow for presentation.
• One-click brainstorm Mode is featured.
• Concept Draw office 4 - $499/ month
• Concept Draw Pro 11 - $ 199/ month
• Concept Draw Project 8 - $ 299/ month
• Concept Draw Mind Map 9 - $199/ month
• Concept Draw Mind Map for Project 4 - $399/ month
• Building technical scheme and diagrams
• Ability to exchange data with Microsoft project,
•Microsoft office, Concept Draw project, Mind manager, XMind and FreeMind.
Grapholite
Grapholite is flowchart software that is easy to use, inexpensive, and very powerful alternative to Visio that users can use for all types of business graphics, floor plans, flowcharts, office layouts, UML diagrams, mind maps, organizational chart, and BPMN diagrams. Grapholite enables you to design the most complex diagram. Grapholite provides an intellectual algorithm that enables users to make automatic connections between the diagram elements. The flowcharts tool enables you to understand how logical processes are while discovering the problems areas and relations breaks as well as creating a common knowledge base for any process. Flowcharts also enable documentation and…
• Flowcharts
• Organization charts
• Site maps
• Venn diagrams
• Mind maps
• UML diagrams
• Swimlanes
• Swot analysis
• Web site wireframes
• Workflow diagrams
• TQM diagrams
• Chevron and circular diagrams
• Personal - $49.99
• Business - $99.99
• Team - $999.99
• Flowcharts
• Organization charts
• Site maps
• Export to the most commonly used picture and document formats
• Ability to work in online and offline modes; in and out of browser
• Smart drawing tools, automatic connectors and shape library to create flow charts of algorithms and procedures
iGrafx FlowCharter
iGrafx FlowCharter is a flowchart software that provides easy to use features for modelling of processes and analysis tool that are ideal to the improvement of business processes in an organization. iGrafx FlowCharter provides an excellent platform for creating of graphical representations of processes that enable people to easily understand any business information. iGrafx FlowCharter can be used as standalone tool or integrated with other solutions to enhance a powerful way of drawing flowcharts than mapping products or generic charting. iGrafx FlowCharter enables you to reduce the time taken to document business systems and processes. It also enables you to…
• Intelligent diagramming
• Lean value stream mapping
• Wide selection of diagram types
• Multilingual content
• Model publishing
• Document lifecycle management
• Team collaboration
• Hierarchical process organization
• Visio import
Contact for Pricing
• Intelligent diagramming
• Lean value stream mapping
• Wide selection of diagram types
• Maximize mapping productivity and minimize errors
• Improve model consistency and understanding
• Achieve breakthrough improvements through reducing waste
Cacoo
Cacoo is an online drawing software which helps users create a wide range of diagrams such as wireframes, flowcharts, UML, org charts, mind maps, share plans and layouts, and work schedules instantly with team members in the same office or around the world. Cacoo offers features such as real-time collaboration, a wide variety of stencils, multiple background and sheets, flexible connectors, editing history, export support in SVG and PDF, diagram sharing and chat with collaborators features, post comments on public projects, powerful app integrations including Google Drive, Confluence and Visio, vast amount of templates and shapes and easy sharing options…
• Cloud-based Collaboration
• Templates & Shapes
• Easy Sharing
• Project Folders
• Revision history
• Exporting options
• Commenting
• Embedded diagrams
• Visio alternative
• Integrations
• Plus - Single-user plan, $4.95/mo
• Team - Multi-user plan, $15/mo
• Enterprise- Install on your private server, get a quote on site
• Cloud-based Collaboration
• Templates & Shapes
• Easy Sharing
Top Free Flowchart Software
You may want to review How to Select the Best Flowchart Software for Your Business


Adobe Spark
Adobe Spark is a suite of design tools that allow users to make posters, videos and web pages using a computer or iOS mobile device. Adobe Spark simplifies content creation to a level that anyone can master on the first day. Adobe Spark’s flyer maker helps your flyers look professional while keeping the design process quick and easy. Flyer design is important, and images speak for themselves and can go a long way toward communicating tone and feel. Spark flyer maker users can better promote their cause with easily shareable content that is sure to inspire. Spark Post lets users…
• Beautiful typography: Choose from a variety of free professionally designed fonts and for every occasion
• Professional themes: Wide variety of best-in-class layouts, colors, and fonts
• Iconic imagery: Select from thousands of photos on the web or pick from your personal collections on Adobe Creative Cloud, Lightroom CC, Dropbox or Google Photos
• Quick font searching: Filter fonts using classifications such as handwritten or serif
• Styles include also-editable filter-like effects to images that match each typeface, text box style, etc
• Texture & Transparency Editor
• Iconic imagery: Select from thousands of photos on the web or pick from your personal collections on Adobe Creative Cloud, Lightroom CC, Dropbox or Google Photos
• Quick font searching: Filter fonts using classifications such as handwritten or serif
• Styles include also-editable filter-like effects to images that match each typeface, text box style, etc
• Make an impact: Watch published creations make an impact as they receive views and likes from your audiences
• Mobile and web: Projects are automatically synced across the web or the iOS apps
• Fine-tune: Add or change textures, play with color and arrangement, blend, and adjust transparency
Canva
Canva is a user-friendly, reliable and simple design platform for businesses, organizations, and even individual professionals which enables them to create amazing and professional quality graphic designs. Canva offers features such as photo straightener, image cropper, add text to photos, speech bubble maker, image transparency tool, photo enhancer, 8,000 templates, photo blur, photo vignette, design grids, free icons, photo frames, web wireframe, stickers, badges and add texture. Canva has a powerful drag and drop editor with its vast selection of images, fonts, and templates which makes it easy for users to build documents and designs from scratch. Canva lets users…
• Two folders to organize designs
• Up to 10 team members for free
• 1GB storage for photos and assets
• Access to over 8,000 templates
• Upload your own images
• Access millions of photos for $1 each
• Magically resize your designs
• Upload custom fonts for your brand
• Set color palettes for your brand
• Save templates for you and your team
• Organize your photos with folders
• Easily find your designs with search
• Priority support
• Canva - Free forever
• Canva for Work - $12.95 per user per month
• Canva Enterprise – Contact on site
• Two folders to organize designs
• Up to 10 team members for free
• 1GB storage for photos and assets
Visme
Visme is an infographic software that provides simple and intuitive solutions that will transform the way you communicate visually. Visme enables you to create infographics in three simple steps, which are quick start, visualising your information, and editing and customising your infographic. In the first step, Visme provides you with an excellent platform for tapping into their professional templates as well as allowing you to create your own custom layout for your infographic. Visme provides hundreds of beautiful templates, designed infographics, and report templates. With, Visme you have an excellent platform for creating your own layout by allowing you to…
• Graphs and tables
• Maps and data widgets
• Images and icon
• Use ‘smart’ shapes and lines that stretch to fit your design needs • Create pictographs that use icons to visualize bar chart segments
• Generate icons arrays to visualise segments of a population
• Create professional tables and customize
Edraw Mind Map
Edraw provides different products and tools that can be used for mind mapping and which can be accessed for free. Edraw Mind Map if a freeware software that allows users to use their samples and templates to create mind maps or charts of all kinds, to brainstorm ideas, to connect and associate complex data, and to share information. It is a compatible with Microsoft applications, easy to use diagram creation software, and does not require any payments for monthly fees or for updates. Edraw Max is another software optional extension, compatible with it, which can be used to extend its…
• Mind Maps and Charts creator
• Examples and Templates
• Smart drawing guide
• Integrates with Microsoft Office
• Ready-made symbols
• Smart mind mapping guide
• Automatic layout making mind maps
• Importing and Exporting capabilities
• Mind Maps and Charts creator
• Examples and Templates
• Smart drawing guide
yEd
yEd is a desktop application that can be used to quickly and effectively generate high-quality diagrams. Users can create diagrams manually, or import their external data for analysis. yEd’s automatic layout algorithms arranges even large data sets with just the press of a button. yEd is freely available and runs on all major platforms: Windows, Unix/Linux, and Mac OS X. With yEd users can Import their own data from an Excel spreadsheet (.xls) or XML, create diagrams with ease via an intuitive user interface, automatically arrange their diagram elements and export bitmap and vector graphics as PNG, JPG, SVG, PDF,…
Import users’ own data from an Excel spreadsheet (.xls) or XML
Create diagrams via an intuitive user interface
Automatically arrange diagram elements
Export bitmap and vector graphics as PNG, JPG, SVG, PDF, SWF.
Contact for Pricing
Flowgorithm
Flowgorithm is a free application that helps to create programs using simple flowcharts. Typically, programs are written using a text editor. Depending on the programming language, this can be either easy or quite difficult for a beginning programmer. Many languages require you to write lines upon lines of confusing code just to get it to display "Hello, world!”. However, using Flowgorithm, the user can use shapes to represent the different actions that are needed for the created program to perform. So, the user can concentrate on the algorithm rather than all the nuances and details of a typical programming language.…
Easy to understand output
Graphical variable watch window
Interactively generate code (for 12+ languages)
Safe recursion
Loops, arrays, and flexible expressions
Multilingual support
Free
Dia
Dia by The GNOME Project is a GTK+ based diagram creation program for GNU/Linux, MacOS X, Unix, and Windows, and is released under the GPL license. It is roughly inspired by the commercial Windows program 'Visio,' though more geared towards informal diagrams for casual use. Dia can be used to draw many different kinds of diagrams and it currently has special objects to help draw entity relationship diagrams, UML diagrams, flowcharts, network diagrams, and many other diagrams. It is also possible to add support for new shapes by writing simple XML files, using a subset of SVG to draw the…
Initial gradient support for Standard objects
Object upgrading like "Upgrade to Bezierline" in context menu
Optional OGDF based automatic layout plug-in
Transparency
Text fitting options for Flowchart objects
Groups can be scaled and rotated
Free
FreeMind
FreeMind is a free mind mapping software which gives users the flexibility to organize thoughts on a page as they connect to each other and to the larger picture and also lets users edit Mind maps, XML/HTML documents, and directory trees. FreeMind offers features, including scads of icons and color formatting options to help users visually organize concepts, provides support hyperlinks, which allow users to link Web sites and even documents to a map and users will be able to export their landscape of thoughts in a variety of formats, including HTML, PDF, and JPEG. FreeMind lets users keeping track…
• Fully functional following of HTML links stored in the nodes, be it www links or links to local files.
• From very early versions, Freemind supports folding which is its essential property.
• Fast one-click navigation, including folding / unfolding on one click and following links on one click at the same time
• Undo
• Smart Drag'n Drop, including the possibility to copy nodes or copy style of nodes; dragging and dropping of multiple selected nodes; dropping of texts or list of files from outside
• Smart copying and pasting into, including pasting of links from HTML or structuring the pasted content on the basis of the number of leading spaces in a line; pasting of lists of selected files
• Smart copying and pasting from, including plain text and RTF (MS Wordpad, MS Word, MS Outlook messages).
• Free
• Export of map to HTML, with folding (see example)
• Find facility, where found items are shown one by one as you do "find next", and the map is unfolded only for the current item.
• Possibility to use and edit long multiline nodes; even with newlines
Plantuml
PlantUML is a component that allows users to quickly write sequence diagrams, usecase diagrams, class diagrams, activity diagrams, component diagrams, state diagrams, deployment diagrams, object diagrams and wireframe graphical interfaces. Diagrams are defined using a simple and intuitive language. Images can be generated in PNG, SVG or LaTeX format and it is also possible to generate ASCII art diagrams for sequence diagrams. Moreover, the component can be run on various platforms including Emacs, Open Office, Word and Sublime Text Editor. PlantUML can also be integrated with wikis and forums like NodeBB Forum, Confluence Cloud, Ikiwiki and Slack. The component can…
Sequence diagram
Usecase diagram
Class diagram
Activity diagram
Component diagram
State diagram
Deployment diagram
Object diagram
Wireframe graphical interface
Free
VisiRule
VisiRule provides a simple, joined-up and stripped back way to organize and share knowledge. Each chart generates a user questionnaire and a detailed map to guide the user on their journey. The chart diagram also acts as a canvass to visualize visiting patterns and help find ways to understand and improve the chart's performance using analytics. Use Artificial Intelligence (AI) to Win New Customers and Secure Existing Business. VisiRule is an AI-enhanced tool which enables business professionals to capture, explore and execute expert knowledge. AI provides advanced knowledge representation and sophisticated algorithms such as fuzzy logic and natural language processing.…
ntelligent Drawing and Design Tool
Automatic Layout Support
Configurable Viewing Options
Shareable Charts
In-Situ Execution and Code Generation
Rich Set of Question Types
Code Boxes
Statement Boxes
Integration with IDE
64-bit Arithmetic
Multiple Document Interface
Dynamic Link Libraries
Direct Windows API interface
Automatic Configuration
Language Interfaces
Small Memory Requirements
Free trial available. Contact for more pricing details.
RAPTOR
RAPTOR is a flowchart-based programming environment, designed specifically to help students visualize algorithms and avoid syntactic baggage. RAPTOR programs are created visually and executed visually by tracing the execution through the flowchart. Required syntax is kept to a minimum. Students prefer using flowcharts to express algorithms, and are more successful creating algorithms using RAPTOR than using a traditional language or writing flowcharts without RAPTOR. RAPTOR is written in a combination of Ada, C# and C++, and runs in the .NET Framework. RAPTOR begins by opening a blank workspace with a start and end symbol. The user can then add flowchart…
Plugin methods that return String.
All prompts/outputs are expressions.
Set_Precision(digits) allows you to specify how many digits of precision will be in an output.
Redirect_Output_Append allows you to redirect output to a file, appending the data on the end.
New time functions
Free
Visual Logic
Visual Logic allows the user to learn programming fundamentals in a classic manner while building solutions using intuitive graphical flowcharts. Watch as the user’s solution executes and provides immediate, accurate feedback and experience the difference that comes from learning logic and design rather than syntax in a programming class. Visual Logic provides a minimal-syntax introduction to essential programming concepts including variables, input, assignment, output, conditions, loops, procedures, arrays and files. Based on research that shows students have more success when they start by focusing on concepts rather than syntax, Visual Logic allows instructors to present material in a clear and…
Provides immediate feedback
Loops: pre-test, post-test
Nested conditions, compound conditions
Parameter passing by value, parameter passing by reference, recursion
Debugging
Enhanced I/O
Intuitive interface
Arrays, multimedia support, great graphics
Free
ClickCharts
ClickCharts is a flowchart software that provides flexible diagram creation and drawing. ClickCharts provides you with an excellent platform for easy creation of visual representation of an organization, process, a mind map or any other diagram. ClickCharts provides you with flowcharts that enable your organization have a unique way of organizing and displaying data that includes the highly comprehensive processes. ClickCharts provides an ideal way for troubleshooting, visualizing your data, optimizing processes, and sharing information. The critical features offered by ClickCharts include chart templates, creating of multiple symbols and line connector styles, creation of unified modified modelling and standard visual…
• Chart templates to get you started
• Choose from a variety of symbols and line connector styles
• Create UML standard visual modelling diagrams
• Open and edit multiple flow diagrams simultaneously
• Detail control for artistic styles for filling and lining
• Edit and customize colours, fills, and strokes
Contact For Pricing
• Chart templates to get you started
• Choose from a variety of symbols and line connector styles
• Create UML standard visual modelling diagrams
• Provides a unique way of organizing and displaying data that includes the highly comprehensive processes
• provides an ideal way for troubleshooting, visualizing your data, optimizing processes, and sharing information
• Present flowcharts in an easy way by using unified modelling language
Inkscape
Inkscape is an open-source vector graphics editor similar to Adobe Illustrator, Corel Draw, Freehand, or Xara X. What sets Inkscape apart is its use of Scalable Vector Graphics (SVG), an open XML-based W3C standard, as the native format. The design process may begin by doodles on a napkin, a sketched mindmap, a photo of a memorable object, or a mockup in software which really wouldn't work to complete the project. Inkscape can take the user from this stage to a final, professional-grade design format which is ready for publication on the web or in physical form. If the user is…
Object manipulation Object creation Fill and stroke Operations on path Rendering Array of file formats Text support
Free
LARP
Logic of Algorithms for Resolution of Problems (LARP) is an educational software for teaching algorithmic in structured programming using pseudo code and flowcharts and is a programming language for the purpose of rapid prototyping of algorithms. LARP's main advantage over traditional programming languages is its flexible and semi natural syntax, allowing one to formulate algorithms without the impediments of cryptic languages such as C++, Pascal or Java. LARP's syntax is straightforward and easy to understand, even for a non-programmer. LARP also allows algorithms to be expressed as flowcharts. The user therefore focuses on conceiving algorithms rather than learning to use…
Simple programming for beginners and experts
Easy-to-use interface
User friendly
Flowcharts
Freeware version available. Contact for more pricing details.
ThinkComposer
ThinkComposer is flowchart software that enables you to apply the comprehensive power of visual documents to complete tasks in a better and fast way. ThinkComposer enables embedding of concept maps, flowcharts, and models into presentations and text-docs that represent the knowledge and insights of every specialized environment and domain. ThinkComposer enables composing of ideas within ideas at multiple levels. The composing of ideas allows each idea to have a complete diagram. ThinkComposer provides an excellent platform for specialization of visual elements to represent a domain. The specialization enables ideas to have their own information and graphic style based on semantics…
• Compose ideas within ideas, at multiple levels
• Specialize visual elements to represent your domain
• Connect ideas using powerful relationships
• Show/hide and format the relevant details
• Extend ideas with valuable information
• Ideas can be based on definition/types, thus allowing reuse
Free
• Compose ideas within ideas, at multiple levels
• Specialize visual elements to represent your domain
• Connect ideas using powerful relationships
• Capture and develop those bright ideas you have
• Help your mind to organize and visualize complex thoughts
• Clearly present your ideas, to be convenient and fully understand
LibreOffice Draw
LibreOffice Draw LibreOffice Draw is a powerful office and flowchart software that provides a clean interface and tools that enable users to unleash their creativity and enhance their productivity. The impress feature is the main feature that enables users to create and edit slides easily and in a versatile way. The components present in the impress feature include; normal, outline, notes, slide sorter, and hand out. Each of these components have its own unique properties. The normal feature provides you with an excellent platform for general editing of flowcharts. The notes feature provides an ideal platform for editing and viewing…
• General editing
• Organize and outline your text content
• View and edit flowchart diagram
• Locate and order flowchart diagram
• Control 3D scenes
Free
• Edit documents with ease
• Work smarter with spreadsheet
• Perfect presentations
• Enables powerful way of creating complete books with contents, diagrams, and indexes
• Allows you to apply fonts that are on your computer and set and customize styles for virtually every part of your document
• Helps you to use templates with built-in functions that allow you to reuse a pre-prepared sheet and just focus on the immediate work
Diagram Designer
Diagram designer is flowchart software that provides simple vector graphics used for creating flowcharts, UML class diagrams, slide shows, and illustrations. Some of the tools provided by Diagram Designer include template palettes, dictionaries, online help, and support diagram designer. The dictionary file contains simple text files arranged in a list of words. The names of the simple file texts have to be formatted to be used by Diagram Designer. The dictionaries feature enables downloading and extracting the zip files by using languages you need. Diagram designer provides an options dialog that enables users to place their files in folders when…
• Customizable template object palette
• Spellchecker
• Import/export EMF, JPEG, WMF, MNG, GIF, and PCX images
• Slide show viewer
• Simple graph plotter to plot mathematical expressions
• Advanced “pocket” calculator with equation solver
• Uses compressed file format for minimizing drawing file size
• Meesoft Image Analyzer integration for bitmap image and editing and extended file format support
Free
• Customizable template object palette
• Spellchecker
• Import/export EMF, JPEG, WMF, MNG, GIF, and PCX images
• Helps users to plot mathematical expressions
• Allows users to solve complex equations
• Helps user check their spellings by using the spellchecker tool
Draw
Draw.io is an open source technology stack for building diagramming applications, and is a widely used browser-based end-user diagramming application. draw.io online is a free-to-license web application for everyone. It is completely free to use for any purpose, there is no premium pay-for functionality, watermarking, or other limitations. You own the content you produce with draw.io and may use it for any purpose, including commercially. Complex business processes and workflows are much easier to understand when presented in diagram form. The shape library includes all the components you need to build your BPMN diagrams. UML diagrams make it easy to…
Create use case, communication, sequence, interaction, class, object and package diagram
Use draw.io’s drag & drop interface or the automatic layout function to create your flow charts quickly and easily.
Use mind maps to help you remember information that you are studying, solve problems
To create mockups of your application interfaces and mobile websites to optimize their usability, and keep your customers happy
Contact for Pricing
Create use case, communication, sequence, interaction, class, object and package diagram
Use draw.io’s drag & drop interface or the automatic layout function to create your flow charts quickly and easily.
Use mind maps to help you remember information that you are studying, solve problems
Pencil
Pencil is flowchart software designed for provision of open source and free prototyping tool that enables people to easily install and use it for creating of mockups in known desktop platforms. The key features provided by Pencil are; GUI prototyping, built-in share collections, diagram drawing support, exportation of outputs to different formats, easy location of Cliparts from the internet, and linking of inter-page. The inter-page linking feature enables drawing of elements and linking them to specific pages in the same document. The inter-page linking feature also provides an excellent platform for defining the flow of UI when creating website mockups…
• Inter-page linking
• Easily find cliparts from the internet
• Export to different outputs formats
• Diagram drawing support
• Built-in shape collection
• Easy GUI prototyping
Free
• Inter-page linking
• Easily find cliparts from the internet
• Export to different outputs formats
• Enables users to easily locate cliparts by keywords and add them into the drawing by a simple drag and drop operation
• Helps users to define the UI flow when creating application or website mockups
• Allows users to see a simulated flow when clicking on the UI elements
How to Select a Flowchart Software
The objective of Flowchart Software is to represent algorithm, workflow or process. The selection of Flowchart Software depends on understanding, assessing and prioritizing your requirements, shortlisting the vendors based on your requirements, products features and functionality, industry experience and prior implementation experience. You will have to closely assess the products capabilities of shortlisted vendors with your user cases with demos, which finally leads to selection of an effective, Flowchart Software which suits to your business requirements.
Here are some tips for Selecting an effective Flowchart Software.
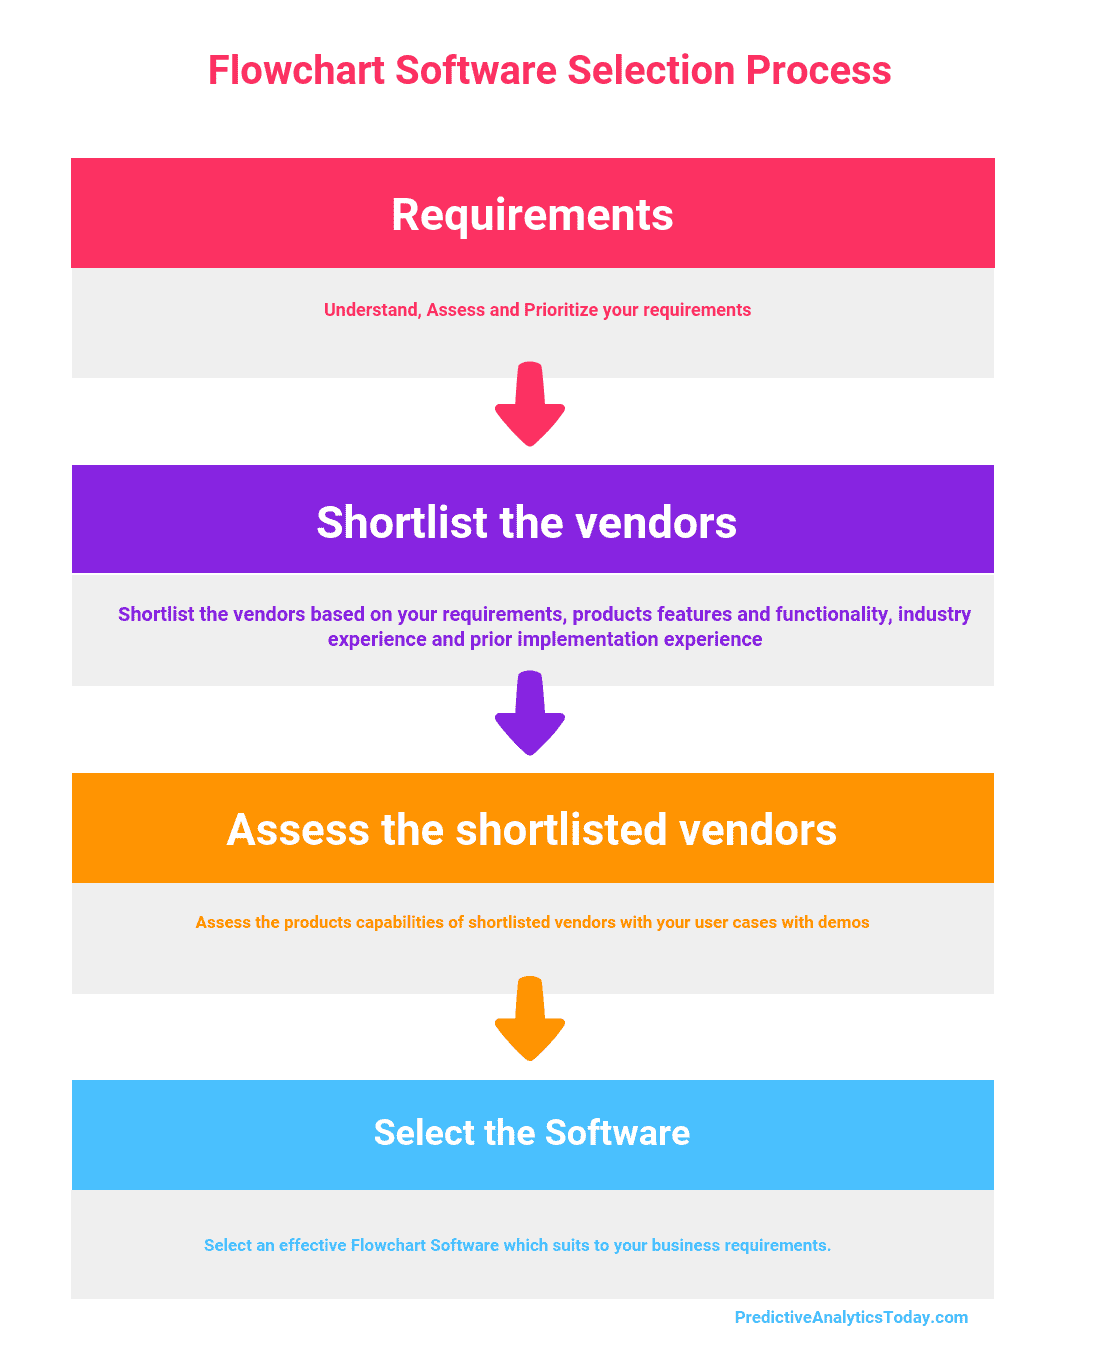
Steps to Select Flowchart Software
What is Flowchart Software?
Flowchart Software is used to draw diagram of type flowchart which is made of boxes and arrows. Flowchart Software are used in designing and documenting simple processes or programs. Flowchart Software help to visualize what is going on and help to understand a process,. It is also used to find flaws, bottlenecks, and other less-obvious features within it.
What are the Top Free Flowchart Software?
Adobe Spark, Canva, Visme, Edraw Mind Map, yEd, Flowgorithm, Dia, FreeMind, Plantuml, VisiRule, RAPTOR, Visual Logic, ClickCharts, Inkscape, LARP, ThinkComposer, LibreOffice Draw, Diagram Designer, Draw, Pencil are some of the Flowchart Software.
What are the Top Flowchart Software?
Visio, Adobe Spark, Canva, Visme, Creately, Lucidchart, Gliffy, SmartDraw, ConceptDraw MINDMAP, Grapholite, iGrafx FlowCharter, Cacoo are some of the Flowchart Software.


ADDITIONAL INFORMATION
Our product Creately can be used to create flowcharts. We have a separate library for flowchart objects, have many templates and have some productivity features to make flowcharting faster.
ADDITIONAL INFORMATION
I’d say ConceptDraw MINDMAP is good for ….mind mapping, but their othr tool – ConceptDraw PRO is the right for diagramming, flowcharing and any other drawings 🙂
ADDITIONAL INFORMATION
Please consider adding a review for MyDraw – it is an excellent MS Visio alternative for Windows and Mac and has great support for flowcharts including many templates.