Sign in to see all reviews and comparisons. It's Free!
By clicking Sign In with Social Media, you agree to let PAT RESEARCH store, use and/or disclose your Social Media profile and email address in accordance with the PAT RESEARCH Privacy Policy and agree to the Terms of Use.
Business Intelligence
Now Reading
DataMares uses Tableau to analyze and monitor marine life in the Gulf of California
DataMares uses Tableau to analyze and monitor marine life in the Gulf of California
DataMares uses Tableau to analyze and monitor marine life in the Gulf of California : Scripps Institute of Oceanography’s dataMares initiative is using Tableau to analyze and monitor data on marine life in the Gulf of California. Scripps Institute of Oceanography conducts studies of the physics, chemistry, geology, biology, and climate of the earth. There are hundreds of research programs in a wide range of scientific areas on every continent and in every ocean. DataMARES, provides users the tools for making informed decisions and act as a platform that serves as a base line tool for historical information, one-time data collection and long-term monitoring data of coastal and marine ecosystems in the Gulf of California and around the world. The dataMares initiative collects massive amounts of data on the Gulf’s marine populations with the goal of informing conservationists, fishermen, governments, and other stakeholders to make data-driven decisions about managing marine populations.
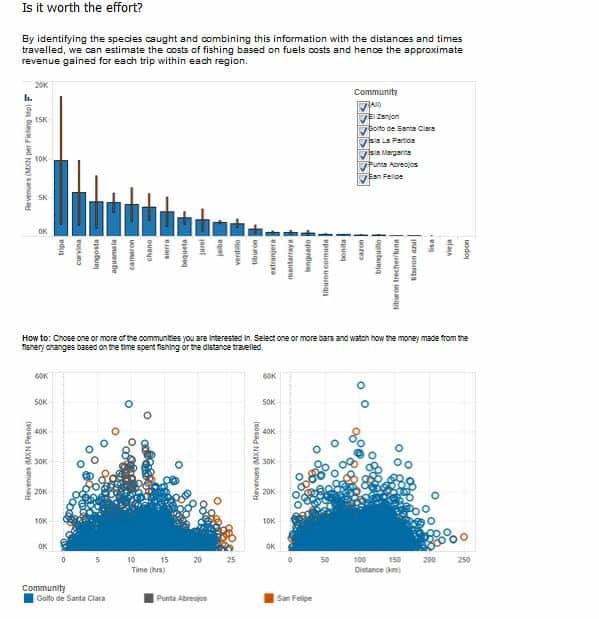
“An important part of our job is communicating complex data to people who aren’t necessarily scientists,” said Dr. Octavio Aburto-Oropeza, an assistant Professor at Scripps’ Center for Marine Biodiversity and Conservation. “Tableau lets us quickly create informative and in-depth dashboards that can communicate data in a much richer way than a scientific report could alone.” As he explains it, Dr. Aburto-Oropeza’s job is to “count fish and tell stories about them.” To do this, his team at dataMares must analyze huge amounts of information. Since 1998, scientists in the Gulf of California Marine Program have monitored data from 260 sites in the region, including information gathered on 5,000 scientific dives and survey data on as may as 1,500,000 individual organisms.
DataMares uses Tableau to analyze and monitor marine life in the Gulf of California
With Tableau, the dataMares team is able to track this data and share it with stakeholders in a meaningful way. By collecting data on fishing patterns, the team hopes to inform fisheries about which areas of the Gulf are being impacted by overfishing. The team maintains a database of 3 million “landings” – or each haul of fish taken from the Gulf – to help the Mexican National Commission of Fisheries and Aquaculture address these problems.
“Our number one goal is protecting the oceans, a natural resource that belongs to all of us,” said Dr. Andrew F. Johnson, a postdoctoral researcher at Scripps and dataMares Editor-in-Chief. “Tableau helps us make informed decisions about our efforts and it has completely changed the way we communicate our data. Within dataMares, it has opened up data analytics to anyone, including those without programming knowledge. And for our external stakeholders, we’re able to publish data-rich dashboards quickly – a critical asset in a field where data must be topical and timely.”
In addition, the dataMares team uses Tableau Public to develop and publish visualizations to its website. These dashboards allow the larger community to view and share scientific data. Johnson says these public-facing dashboards have had a tremendous impact.


By clicking Sign In with Social Media, you agree to let PAT RESEARCH store, use and/or disclose your Social Media profile and email address in accordance with the PAT RESEARCH Privacy Policy and agree to the Terms of Use.