


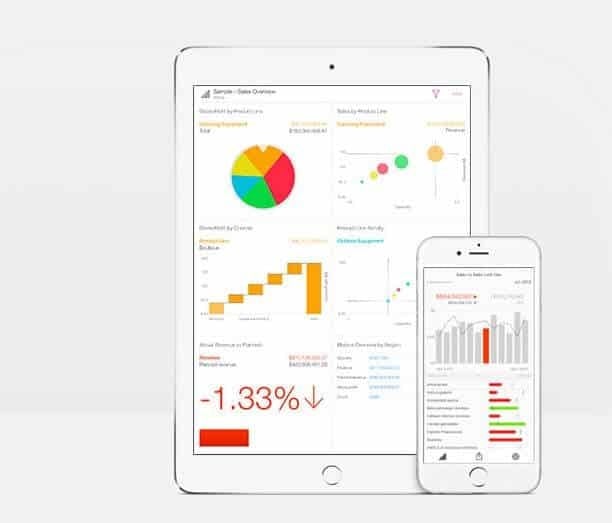
Roambi provides data visualization for mobile users. Roambi’s Analytics transforms data collected from different sources in to a simple and engaging experience and better understand what those numbers mean and how it can affect the business.
Instead of static dashboards, Roambi Analytics is made up of 10 dynamic, integrated visualizations called "VIEWS”. These views make it easier for the users to understand how to navigate and visualize all data in just one place. Roambi Delivers Native Applications, Instantaneous Performance with NO SPINNERS, 100% Offline Functionality for Mobile and PC and Beautiful, Integrated Visualizations. Use Roambi not only on mobile devices but also on PC too.
Roambi’s Analytics features Blink where in integrating CSV files to mobile devices such as iPhones and iPads are as easy as it can be. Manage all information using personal devices and still be able to view and work even outside the work area.
Roambi Flow is another great feature that let users create multi-touch publications that not only show analytics data but also be able to customize it together with videos, images and other interesting contents. This also promotes better experience and establishes better connections with the company’s leads.
When it comes to security, Roambi takes it seriously and make sure that all data is protected and that it is their responsibility to ensure privacy. With App Passcode, users are required to secure a code whenever they need to access. On the other hand, set passcode to offline only, so that users only deal with the inconvenience of entering their code when the app can't connect to the server.
You may like to review: Top Data Visualization Software and How to Select the Best Data Visualization Software for Your Business