


Companies of all sizes have realized that data is a powerful tool if collected and used properly. For this reason, many companies are looking for the best tools to capitalize on their data. Some of the best tools are in the form of applications that allow businesses to capture and analyze data for various purposes. Business Intelligence (BI) is one of the technologies used by businesses to handle data. It is a useful tool especially if your organization handles data on a daily basis. Businesses need it to analyze data and generate actionable information.
Business managers, executives, and other users need this information to make informed decisions. BI tools such as BI software include methodologies and tools for collecting data in different forms, analyzing data, and creating reports. Embedded BI Software is one of the BI tools used to perform these tasks.
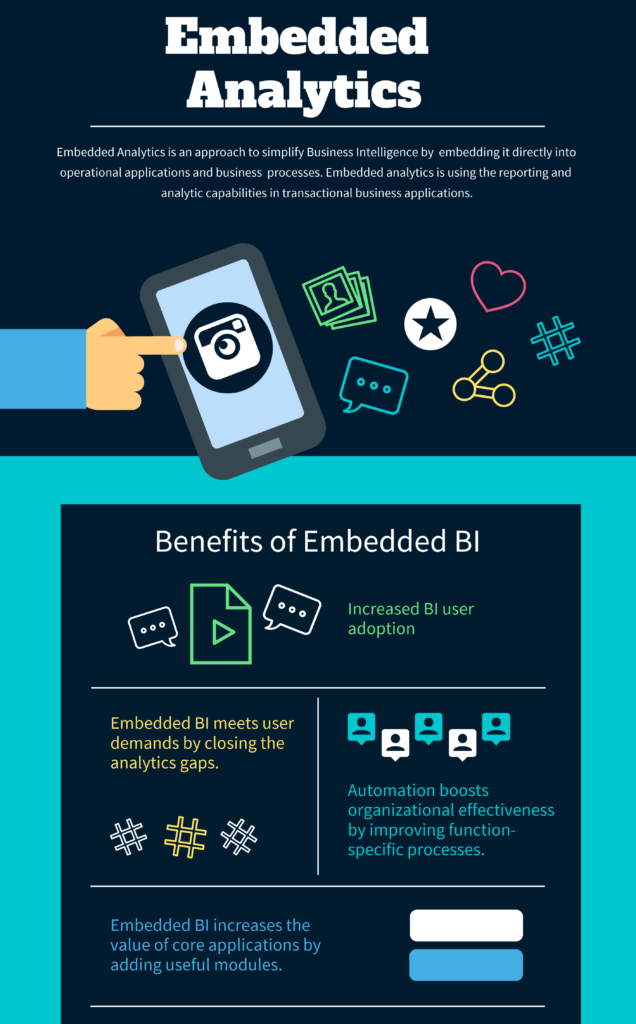
Embedded Analytics is an approach to simplify Business Intelligence by embedding it directly into operational applications and business processes. Embedded analytics is using the reporting and analytic capabilities in transactional business applications. Embedded analytics capabilities can reside outside the application, reusing the analytic infrastructure built by many enterprises, and is easily accessible from inside the application.
What are the Top Embedded Analytics Business Intelligence Software: Sisense, ThoughtSpot, GoodData, Datapine Business Intelligence, MicroStrategy, JReport, Birst BI, WebFOCUS Platform, SAP BusinessObjects BI, Oracle Business Intelligence, Qlik Sense Enterprise, SAP Crystal Reports, Dundas BI, Tableau Server, Exago Business Intelligence, Yellowfin, Cluvio, BIME Analytics, SAS Enterprise BI Server, Zoomdata, Izenda, TARGIT Decision Suite, Logi Analytics, Chartio, HelicalInsight, icCube, Panintelligence are some of the Top Embedded Analytics Business Intelligence Software.
You may like to read: How to Select the Best Embedded Business Intelligence Software for Your Business and Why you should leverage Embedded Analytics for your business success
What are Embedded Analytics Business Intelligence Software?
Embedded BI software refers to software that integrates the features or functions of BI software into existing software applications. It integrates different tools, applications, and methodologies into a company’s existing software to create a more powerful analytics tool. Some of the common embedded features include interactive BI reporting, analytics, dashboards, and data visualization.
Embedded BI software allows businesses to collect and analyze data from different sources. It also provides effective analytics because users can generate data within a very short time. Organizations can make important business decisions and create reports based on this data. In addition, businesses can easily use this data to create value without worrying about the costs of building a new platform.
Businesses that handle large amounts of data need to use embedded BI software because it is the right tool for automating and merging different streams of data into one source of reliable information for business purposes.
Embedded Analytics Business Intelligence Software deliver intelligent, interactive data visualisation directly in your app with a broad range of modern data visualisations, or easily build the custom visualisations .The data is managed by a BI platform and is placed directly within the application user interface to improve the context and usability of the data.
Embedded Analytics Business Intelligence Software intention is to be more pervasive by real-time autonomy, self-service of data visualization and customization, while decision makers, business users or even customers are doing their own daily workflow and tasks.

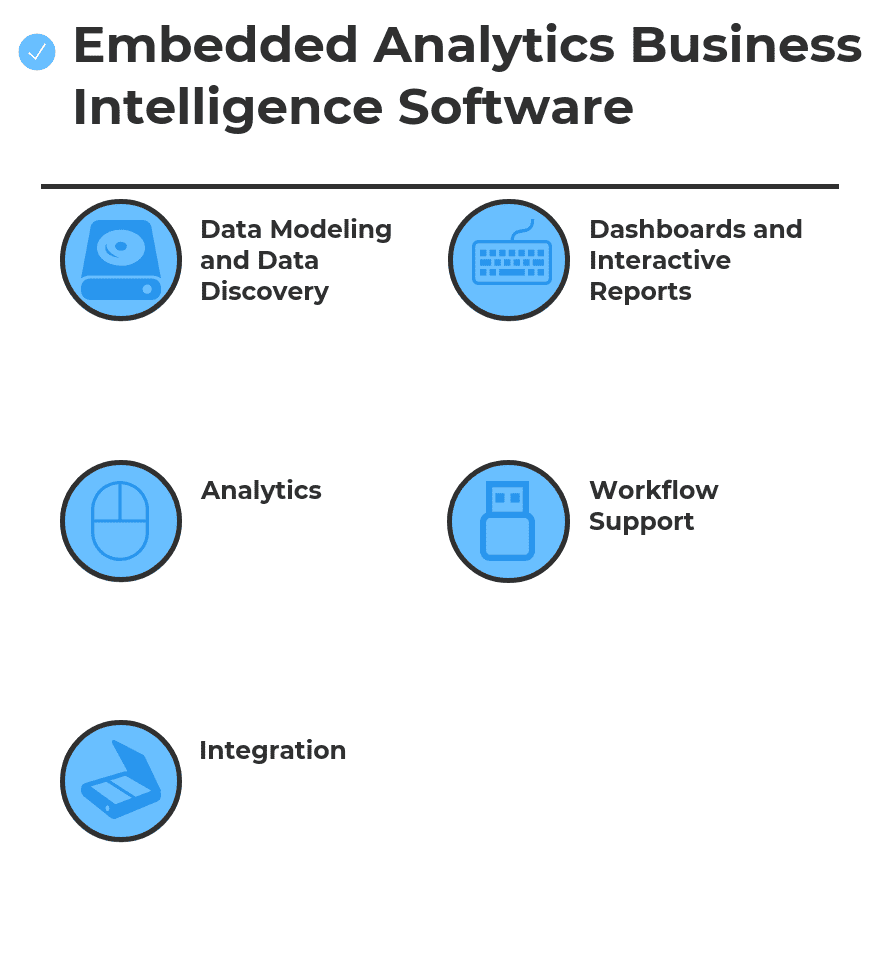
What is Embedded Analytics Business Intelligence Software?
- Data Modeling and Data Discovery: Embedded BI applications allow organizations to collect, define, organize, and display data in a way that is easy to understand. Data analysts can also use embedded BI software to discover new insights.
- Dashboards and Interactive Reports: Customizable dashboards allow users to display data in charts and graphs. Users can also generate, save, modify, and organize reports.
- Analytics: This is an important feature because businesses use it to analyze data and find the appropriate analytics solutions. It also helps businesses to understand their customer’s needs based on the available data.
- Workflow Support: At the advanced level, businesses can use embedded BI software to automate workflow. The application can perform automated tasks based on some user-defined parameters.
- Integration: Embedded BI software integrates with the company’s existing processes, applications, and systems. This means users can grow their businesses without adding unnecessary applications.
Some of the Embedded Business Intelligence Software includes:
- Increased BI user adoption: There is no need to alternate between platforms. Users can use existing applications to collect and analyze data without purchasing stand-alone applications.
- Embedded BI meets user demands by closing the analytics gaps found in many commercial applications.
- Automation boosts organizational effectiveness by improving function-specific processes.
- Embedded BI increases the value of core applications by adding useful modules.
Top Embedded Analytics Business Intelligence Software
Sisense
Sisense simplifies business analytics for complex data. Powered by In-Chip and Single Stack technologies Sisense delivers unmatched performance, agility and value, eliminating much of the costly data preparation traditionally needed with business analytics tools and providing a single, complete tool to analyze and visualize large, disparate data sets without IT resources. Sisense’s expertise in complex data includes both large data sets and data derived from multiple, disparate sources. Sisense leverages In-Chip analytics to dramatically improve business users’ access to advanced analytics on low-cost, commodity machines without the need for special data warehouse tools or dedicated IT staff. One-click formulas offer…
•Join data from multiple sources
•Drag & drop joining of multiple data sources
•Build interactive dashboards with no tech skills
•Share interactive dashboards
•Provide users the freedom to query data in real-time
Contact for Pricing
• Single-Stack™ architecture
• Sisense innovative In-Chip™ engine
• Groundbreaking. Powerful. Simple.
• IoT, machine learning, and AI in cutting edge BI platform
• Easily and quickly get the answers they need from complex data
• Easy to connect your data, get up and running instantly and deliver fast results
ThoughtSpot
ThoughtSpot offers search-driven analytics for enterprises. The company allows users to search and analyze data, ask questions, get instant charts, analyze company data, build reports, share data, and offers dashboards. It serves communication, retail, financial service, healthcare and life science, and manufacturing sectors. ThoughtSpot's allows for non-technical individuals to conduct a self-service data analysis search. ThoughtSpot's relational search engine can analyze information from any data source, including point of sale data, data warehouses, and social media sites. Search-Driven Analytics allows analyzing data and creating reports and dashboards in seconds. There is no need for SQL expertise or lengthy training sessions…
•Guided Search Experience
•On-the-Fly Calculations
•100% Accuracy
•Security
•Unlimited Data Scale
•Easy to manage
•Unlimited Users
From $75,000
•DataRank
•AutoJoins
•PopCharts
• Instant data access
• Guided search experience
• On the fly calculations
GoodData
The GoodData platform includes advanced distribution and product lifecycle management features to automate the process of maintaining one-to-many cloud deployments. GoodData provides a highly engaging guided analytic exploration experience that drives actionable insights by teaching users best practice techniques through recommendations inside the interface. GoodData’s dashboards are responsive, mobile optimized, and include built-in alert, email and collaboration features to promote sharing across the organization GoodData provides groundbreaking BI for data monetization to enterprises, independent software vendors, and system integrators who seek to unlock the value of data for their business networks with engaging, one-to-many analytics. The intelligent analytics distribution platform…
• Deliver Packaged Analytics
• Accelerate Time-to-Market without Compromising Functionality
• Enable Hundreds of Thousands of Business Users to Operate on Massive Datasets
• Boost Security and Compliance
• Seamlessly Embed Analytics In-Context
• Deliver Powerful Analytics
• Technical Capabilities
• Free version
•Growth- 200 per year per customer
•Enterprise- Contact for Pricing
•Operational reporting, strategic analytics and exploratory analytics
•Mobile support and Email alerts
•Responsive visualizations throughout
•Centralized provisioning, subscriber, and lifecycle management
•Benchmarks, scorecards, and data enrichment that increase your business network insights
•Efficient analytics authoring for distribution to network
Datapine Business Intelligence
Datapine provides a scalable SaaS, data analysis tool that gives customers fast and easy access to their business intelligence data without the need for any SQL or database knowledge by using an intuitive drag & drop interface to analyze the database. The result is displayed as a chart or as a table and can be used later on for internal and external reporting purposes. Within minutes customers can connect datapine to their existing databases or external interfaces, such as Google Analytics. Datapine enhance dashboards with style elements such as headlines, text boxes and images and provide optional interactive control elements…
• Ad hoc queries
• Drag & Drop UI
• Powerful filters
• Full tablet support
• Perform advanced Calculations
Contact for Pricing
• Create Custom Columns
• Use familiar excel expressions
• Modify text and date fields
•Online Data Visualization Tools
•Dashboard Designer
•Online Data Analysis Tools
Datapine Business Intelligence
MicroStrategy
MicroStrategy makes sophisticated functionality accessible to every user, from administrators to business analysts. MicroStrategy makes it easy to seamlessly connect to any enterprise resource, including databases, mobile device management (MDM) systems, enterprise directories, cloud applications, physical access control systems, and more. MicroStrategy delivers a broad set of business intelligence services that can be deployed on-premises with MicroStrategy Server or via the MicroStrategy Secure Cloud. This service-oriented architecture dynamically assembles metadata objects and provides the core analytical processing power for any business intelligence project. MicroStrategy analytics platform meets the needs of business and IT. It empowers organizations to make sense of…
• Low total cost of ownership
• Enterprise readiness.
• Ease of use.
• Self-service analytics
• Advanced analytics
$600 per user
Contact for Pricing
• Enterprise Assets
• Tools
• Metadata Repository
•Data Visualization Software
•Dashboard Software
•Reporting Software
JReport
Jinfonet Software, is a leading provider in Java reporting, and features Visual Analysis, a new way to enable self-service interactive data analysis powered by high performance in-memory cubes. Visual Analysis in JReport allows report developers and end users to easily transform their data into rich visualization. With instant visual feedback and on-screen drag and drop actions, users can quickly adjust the dynamics of their data visualization resulting in faster discovery of actionable information. Components created by Visual Analysis can be reused in JDashboard for seamless compatibility. Moreover, the intuitive Visual Analysis UI requires a minimal learning curve with no formal…
• Embedded BI
• Dashboards & Reports
• Performance & Scalability
• Data Visualization
Contact for Pricing
• Self-Service BI
• Ad Hoc Reporting
• Seamless Integration
• Easy Dashboards
• Visual Analysis
• Geo Analysis
Birst BI
Networked BI creates a set of interwoven BI instances that share a common analytical fabric. This enables organizations to expand the use of BI across multiple regions, departments and customers in a more agile way, and empowers these decentralized teams to augment their enterprise data with their own local data. Networked BI is different, allowing both top-down and bottom-up blending of data. The result is local execution with global governance, eliminating data silos once and for all and dramatically accelerating the delivery of BI across the enterprise. Birst’s Networked BI platform redefines the way BI is delivered and consumed, eliminating…
• Rapidly unifies complex data
• Broad and complete business visibility, fast
• Analyze complex processes & models
• Real time sync across users and departments
• Blends centralized and decentralized
• Enable local agility with global analyses
• Trust and reuse key metrics
Contact for Pricing
• Values are correct, for ad hoc and scheduled use
• Users can use a variety of tools
• Drive adoption, usage and self-service
• Short time and cost to deploy = lower risk
• Economically scale, on demand
• High performance and superior economics
WebFOCUS Platform
WebFOCUS, is a comprehensive and flexible BI and analytics platform, offers simple to sophisticated analytical tools and apps that enable the visual exploration and answering of a broad range of business questions for users inside and outside the enterprise. Three editions of the product are designed to deliver the many benefits of governed self-service apps and tools to your entire universe of business stakeholders, from management to employees to partners to customers to citizens. WebFOCUS offers self-service analytics with Dashboards and scorecards give executives and managers a high-level view of critical indicators and metrics, Self-service tools allow users to easily…
• Data Discovery
• Predictive Analytics
• Reporting
• Dashboards
• In-Document Analytics
• Location Analytics
• Big Data and the Internet of Things
Contact for Pricing
• Big Data and the Internet of Things
• Sentiment and Word Analytics
• BI and Analytics Smart Search
• Sentiment and Word Analytics
• BI and Analytics Smart Search
• Natural Language Generation (NLG)
SAP BusinessObjects BI
SAP BusinessObjects BI solutions are designed to empower organization to achieve remarkable results by enabling trusted data discovery. The solutions help you to transform decisions by providing fact-based information, regardless of where data resides. Using SAP BusinessObjects BI solutions, organization gains increased visibility of key performance indicators (KPIs) across lines of business, improves relationships with customers and suppliers, saves time and money, and can respond faster when exceptions occur. SAP BusinessObjects BI provides Ad-hoc reporting and analysis and Multidimensional analysis. Answer new and evolving business questions with self-service ad-hoc reporting and analysis – on the Web, your desktop, or a…
• Gain real-time business intelligence from any data
• Increase user autonomy by exposing data in plain business terms
• Make information consumption simple, personalized, and dynamic
• Benefit from a flexible and scalable information infrastructure
Contact for Pricing
• Ad-hoc reporting and analysis
• Multidimensional analysis
• SAP HANA as BI system repository and audit database
• Single sign-on (SSO) integration with LDAP, Kerberos, eTrust SiteMinder, and Windows AD
• Universe semantic layer access to over 40 data sources
• Support for SAP BW 7.x, SAP Business Suite, and SAP S/4HANA
Oracle Business Intelligence
Oracle Business Intelligence simplify your analytics strategy by standardizing on one integrated platform, centralize your data models and metrics for a comprehensive representation of the business and enable business leaders to securely access and explore data no matter where they are via mobile devices and the cloud. Data Visualization in Oracle Business Intelligence offers a rich consumer style experience that is now common across Oracle’s analytics portfolio. Additionally, the entire user experience has been streamlined, demonstrating Oracle’s continued commitment to making analytics as fast, flexible, and friendly as they are powerful and robust. Oracle offers new self service capabilities for…
• Modern analytics platform
• Advanced analytics
• Data visualization
• Mobile
• In-memory enhancements
• Self Service
•Contact for Pricing
• Modern analytics platform
• Advanced analytics
• Data visualization
•BI Server: common enterprise business model and abstraction layer
•BI Answers: ad-hoc query and reporting
•BI Interactive Dashboards: highly interactive dashboards
Qlik Sense Enterprise
Qlik Sense self-service visualization drive insight discovery with the data visualization app that anyone can use. With Qlik Sense, everyone in your organization can easily create flexible, interactive visualizations and make meaningful decisions. Qlik Sense Desktop Import your own data and experience the power of Qlik Sense. Use simple drag-and-drop interfaces to create flexible, interactive data visualizations. Explore data with smart visualizations that automatically adapts to the parameters you set — no need for developers, data scientists or designers. Qlik Sense offers improved capabilities for business users to load, transform, and enrich their data without the need for complex scripting. Qlik…
• Support self-service visualizations
• Guided analytics apps and dashboards
• Embedded analytics and reporting
Qlik Sense® Business-$30
Qlik Sense® Enterprise-$70
• Manageability
• Security
• Scalability
• Governed Creation
• Managed Data Connections
• Modern, Open APIs
SAP Crystal Reports
SAP Crystal Reports turns almost any data source into interactive, actionable information that can be accessed offline or online, from applications, portals and mobile devices. Crystal Reports enables to create highly formatted, pixel-perfect reports quickly with intuitive design interface and efficient workflows and provide broad data connectivity by connecting to information sources spread across the organization directly. Delivers personalized reports to your business users’ preferred destination in their preferred language and format and enable SAP Crystal Reports developers to produce powerful "mash-ups" pulling data from various sources. SAP Crystal Reports With SAP Crystal Reports , you can create powerful, richly…
Dundas BI
As one of the first providers of data visualizations for business intelligence technologies, Dundas Data Visualization is known for software that powers superior user experiences for data consumption. Dundas’ software (Dundas BI) was designed to help more users, regardless of role, discover deeper insights faster, make better decisions, and achieve greater success. With Dundas, your BI experience is completely personal. Dundas BI is an enterprise-level BI and analytics tool, all in one, fully embeddable platform. With its immense built-in functionality, agile data flows adapted to user’s skills, and fully open APIs, business users and analysts gain the ability to run…
•Dashboards & Reports
•Self-Service Analytics
•One Flexible Platform
•Seamless User Experience
•Embedded Analytics
•White Label BI Solutions
Contact for Pricing
•Dashboards & Reports
•Self-Service Analytics
•One Flexible Platform
•One Flexible Platform
•Seamless User Experience
•Embedded Analytics
Tableau Server
Tableau Server, let the whole team securely use interactive data dashboards. When people across the organization can see and understand their own data, they solve problems and discover opportunities. Author dashboards in Tableau Desktop, then share them securely using Tableau Server. Publish shared data models to the Data Server so your whole team can use them. Define data sources, add metadata, and author new calculations and data fields for everyone to us. The Tableau platform is easy to deploy, scale, and monitor, manage permissions, data sources and monitor usage visually. Tableau Server can be implemented on-premise for ultimate control behind…
• Multiply your data’s potential
• Data to the people—responsibly
• Security your way
• Flexible deployment
• Powerful monitoring and management
• Enterprise-ready and enterprise-proven
•Tableau Creator- $70 user/month | billed annually
•Tableau Explorer- $35 user/month | billed annually
•Tableau Viewer $12 user/month | billed annually
• Embed Insights into your workflow
• Stay on top of your changing data
• It’s live and it’s in-memory
• Empower your business by putting analytics
• Advanced high availability, robust failover
• Supports seamless scaling with no downtime
Exago Business Intelligence
Exago provides a powerfull, flexible, true self-service business intelligence solution that puts ad hoc reporting, dashboards and analytics in the hands of end users. Exago is a tool for application software and service providers to integrate into their own products, thereby increasing the value of their offerings to their customers and prospects. Express Reports is perfect for building and formatting basic tabular reports. Standard Reports is a familiar, Excel-like design grid with advanced functionality. Crosstab Reports is for power users. Exago is an enterprise BI solution that allows non-technical end users to create and edit reports and dashboards without IT…
• Express Reports
• Standard Reports
• Crosstab Reports
• Dashboard Designer for end users
• Charting and graphing
• Geographical maps
• Linked reports and drilldowns
Contact for Pricing
• Pixel-perfect templates
• Automated Report Scheduler
• User-defined formulas
•Sophisticated styling
•Geographical maps
•Embedded web pages
Yellowfin
Yellowfin is designed to support a range of BI users and use cases, and to discover how to instill a culture of data-driven decision-making throughout the organization. Yellowfin is a global Business Intelligence (BI) and analytics software vendor who provides a highly intuitive 100 percent Web-based reporting and analytics solution. Yellowfin is a leader in mobile, collaborative and embedded BI, as well as Location Intelligence and data visualization. Yellowfin’s personalized and interactive dashboards improve business performance at all levels of your organization. Track your corporate KPIs with rich, graphical presentations using maps, graphs and tables. Easily assign goals and collaborate…
• Dashboards that put all your data in one place
• Visualize your data from any angle
• Tell amazing stories with your data
• Yellowfin is mobile
• Connect to all your data
• Yellowfin Analytics-From $50 per user per month
• Yellowfin Stories - From $10 per user per month
• Custom Quote- Contact for Pricing
• Dashboards
• Analysis
• Cloud
• Awesome analytical apps
• Prepare your data for analysis
• Ensure trust with data governance
Cluvio
Cluvio is a cloud analytics platform for startups and data-driven teams, trusted by over 100 companies. Users can use SQL and R to analyze their data and in a few minutes create beautiful, interactive dashboards for their entire company. There is a wealth of information hiding in the data in the users’ database that is just waiting to be discovered. Daily active users, monthly recurring revenue, signups per day. With Cluvio, users can see the most important KPIs on interactive, real-time dashboards anywhere, anytime. Users can receive alerts for conditions that users define - a sudden drop in number of…
• Advanced Report Creator
• Interactive Dashboards
• SQL Alerts
• Bank-grade security
• EU Data Protection
• Share Dashboards via Link
• Share Dashboards with your Colleagues
• Your data on the wall
• FREE
• Pro $ 279 /mo.
• Business $ 669 /mo
• Enterprise $ 2250+ /mo.
• Custom Dashboard Filter
• Interactive Dashboards
• SQL Alerts
•Share dashboards within your company
•Share dashboards via link
•Share via email
BIME Analytics
BIME allows to connect to both the online and the on-premise world in the same place to create connections to all data sources, create and execute queries and view dashboards easily - all within BIME's beautifully intuitive interface. Build a dashboard with a mouse and a couple clicks. Share it instantly with the world and let your users drill down, drill through and filter the data. BIME have one of the most advanced cross-platform and cross-rendering charting frameworks and all needed is a browser and dynamically ensure maximum reach across all devices.Features include classics plus maps, relational analysis, bullet charts,…
• Make data joins without SQL
• Set up email alerts
• Brand your dashboards
• Share your queries
• Instant forecasting
• Base - $ 490 mo
• Big Data - $ 690 mo
• Manage and analyze your data in one place
• Customize your metrics and KPIs
• 25 ways to visualize your analysis
• Easy sharing and collaboration
• Responsive to all your devices
• Visualize your data store
SAS Enterprise BI Server
SAS BI software integrates the power of SAS, role-based interfaces and Microsoft Office so everyone can make fact-based decisions. SAS Enterprise BI Server can make use of previous investments, integrate BI capabilities quickly into existing environments and get decision makers the information they need. Features include Portal and customizable dashboards, Business visualization, Web and desktop reporting, Mobile business intelligence, Microsoft Office integration, Query and analysis OLAP storage and data exploration, Business metadata management, Flexible deployment options, Guided analysis and model development and Applications development. Interactive visualization capabilities enable information producers to dynamically explore data, investigate patterns and uncover hidden facts.…
• Portal and customizable dashboards
• Business visualization
• Web and desktop reporting
• Mobile business intelligence
• Microsoft Office integration
Contact for Pricing
• Portal and customizable dashboards
• Business visualization
• Web and desktop reporting
• Query and analysis
• OLAP storage and data exploration
• Business metadata management
Zoomdata
https://www.zoomdata.com/
Zoomdata makes it easy to embed visual analytics into any application. The client side of Zoomdata is built using highly flexible, modern web technologies including HTML5, JavaScript, WebSockets, and support for CSS.Zoomdata provide a simple, intuitive, and collaborative way to visually interact with data to solve business problems to enable interactive data visualization at any scale. Zoomdata, exploratory data analysis and visualization platform, empowers business users to see and interact with data. Its unique micro-query architecture delivers results on huge number of records in seconds and gives users a single pane of glass for bridging old and new data.With Zoomdata,…
•Fast Visual Analytics
•Big Data Exploration
•Self-Service BI
•Data Sharpening
•DataDVR
•Multi-Source Analysis
•Dashboards
•Built for Big Data
•Big Data and Hadoop
•Streaming Data
•Search Data
•noSQL Databases
Contact for Pricing
•Search Data
•noSQL Databases
•MPP and SQL Databases
• Accelerate time-to-insight by reducing the clutter that distracts novice users in traditional analytics applications
• Can span a data ecosystem that includes traditional relational databases and new sources like nosql, search, and streaming data
• Stream processes more data through additional micro queries
Izenda
Izenda is a web-based embedded business intelligence (BI) platform that has been purpose-built for OEM use and embedding by software companies. It gives software product teams the ability to enhance their applications with white-labeled self-service analytics in the form of dynamic reports, dashboards and visualizations that deliver data-driven insights to users, while maintaining the look and feel of the existing application. Izenda can be deployed as a self-service analytics portal, or seamlessly integrated with Software as a Service (SaaS), on-premise or hybrid applications on any technology stack. The platform leverages a modern, 3-tier embedded architecture that is lightweight, modular and…
• 100% white labeled integration
• Rapid to deploy, easily customizable, and intuitive for your users to configure
• Built to work for your product, your users, and their data
Contact for Pricing
• Securely deliver self-service BI
• Intuitive user interfaces
• 100% web-based interface, on any device anytime, anywhere
•Reinvent your user experience with rich dashboards
•Quickly deploy a library of prebuilt dashboards
•Enable users to share dashboards with each other
TARGIT Decision Suite
TARGIT Decision Suite is a business intelligence platform that offers visual data discovery tools, self-service business analytics, reporting, and stunning dashboards in a single, integrated solution. TARGIT supports the decision-making process in a world that's changing faster than ever. TARGIT’s business intelligence software combines all the disciplines—from financial reporting to self-service visual data discovery—in one business intelligence platform that can be deployed across the entire organization. TARGIT Decision Suite is an enterprise-wide platform with a vast range of deployment options that can bring centralized business intelligence to everyone in the organization. The solution’s self-service capabilities enable business users to create…
•Dashboards
•Analytics
•Data Discovery
•Reporting
•Data Visualization
Contact for Pricing
•Dashboards
•Analytics
•Data Discovery
•Platform for all data from any source
•Deploy across multiple servers, on premise, or as a cloud solution
•Enable access through Windows, web, or mobile clients.
Logi Analytics
Logi Info is a business analytics platform for rapidly creating analytic applications, deploying scalable dashboards and reports, delivering managed self-service analytics to business users, and embedding analytics into the applications workers use every day. Logi Info includes new interactive visualizations, self-service dashboard authoring, and real-time charts. Updates include faster application development, integration with GIT and TFS, and 2x – 10x faster performance. Logi Analytics, is a leader in self-service analytics, and Logi provides self-service analytics tailored to the unique skills and needs of every individual. Logi consists of Logi DataHub, Logi Info business intelligence (BI) platform and Logi Vision data…
• Connect to Any Data Source
• Create a Unique Experience
• Adaptive Security
• Complete Customization
• Designed to Scale
• Engage Users with Self-Service Analytics
Contact for Pricing
• Embedded self-service reporting
• Mobile ready and responsive
• High-performance data store
• Adaptive security
• Integrated workflow and write-back capabilities
Chartio
Chartio provide its user simple analytics and has been used by many business organizations for its powered solutions. Chartio automatically creates data models as users connect to multiple sources of information. This enables users to create charts as quickly as possible to ensure timely response. Get immediate answers with Chartio as it would only take a few simple steps to have everything set up. Find information that the business needs right away and connect to the multiple sources of data in just matter of seconds and make good use of the time while managing other important work. Chartio’s Optimized SQL…
•Live web interface
•Auto emailed reports
•PDF, SVG & IMG exports
•Optimized SQL
•Fully Customizable Queries
•Unlimited Connections
•Live web interface
•Auto emailed reports
•PDF, SVG & IMG exports
• Powerful processing engine
• Great Query optimization on SQL.
• Completely web-based.
HelicalInsight
HelicalInsight makes it possible to make quick informed decisions from multiple data sources. HelicalInsight includes various data visualization options such as reports, dashboard, geographical analytics as well as statistical and scientific charts. It is also an open source with the lowest total cost of ownership but provides high ROI. HelicalInsight allows its users to interact with data in their own natural English language and let their data answer at the same time. Powered by machine learning and NLP, HelicalInsight empower users with zero technical knowledge also to be a data scientist. Ask questions, get answers and drill down further. HelicalInsight…
•Centralized
•Configurable
•Complementary
•Cost-Efficient
•Secure
•Valuable
Free for 6 months – trial period
•Configurable
•Complementary
•Cost-Efficient
• Design your own workflows
• Export reports and dashboards
• Access data across a variety of devices such as laptop, tablet, tv, mobile, etc.
icCube
icCube is an in-memory multidimensional online analytical processing (OLAP) server written in Java. icCube is a high end BI solution covering ETL, Advanced Analysis (MDX+) and Reporting. A high-performance and real-time Analytical Server with an ETL layer is designed for Big Data and supporting for multidimensional analysis and MDX+ standards. Interactive Dasboards Run on all modern browsers and they are pure HTML5 based (HTML/JS). icCube is designed to integrate into an OEM or Enterprise architecture. It’s a single Java process with a modular design. All access is accomplished through a thin client User Interface. It supports ad-hoc on the fly…
•Ad hoc Analysis
•Ad hoc Query
•Ad Hoc Reports
•Benchmarking
•Budgeting & Forecasting
•Dashboard
•Data Visualization
•Key Performance Indicators
•OLAP
•Performance Metrics
•Predictive Analytics
•Profitability Analysis
•Strategic Planning
•Trend / Problem Indicators
•Enterprise 3 250€ /year +975 /year for 100 users +3 250 /year for 1000 users
•Real Time Module +1 150€ /year +345 /year for 100 users +1 150 /year for 1000 users
•Printing Module +1 150€ /year +345 /year for 100 users +1 150 /year for 1000 users
•Partitioning Module +4 850€ /year +1 450 /year for 100 users +4 850 /year for 1000 users
•Corporate / Project from 48k€
•Benchmarking
•Budgeting & Forecasting
•Dashboard
• Swiss made software
• 0 open-bug policy
• 4.7/5 customer satisfaction
Panintelligence
Panintelligence is a single application which delivers the power of data visualisation through two interfaces. This allows for an optimal user experience across all platforms, i.e. desktop, tablet and mobile. All existing configurations will work in both interfaces. Panintelligence is passionate about helping Partners and Customers run their businesses more effectively using self-service business intelligence (BI) dashboard software. Panintelligence's vision is very simple “Enabling better decisions”. Empowering people can help build trust and pride and motivate them to try their best but it can quickly lead to frustration if the information they need to make a difference is not at…
•Drag and drop easy chart design.
•One reporting toold for all databases.
•Track KPIs and automatically send alerts.
•Access anywhere on any device.
•Drill down and access the underlying data in real time.
•Automatically email scheduled reports.
•From £125 per month
•Drag and drop easy chart design.
•One reporting toold for all databases.
•Track KPIs and automatically send alerts.
You may like to read: How to Select the Best Embedded Business Intelligence Software for Your Business and Why you should leverage Embedded Analytics for your business success
What is Embedded Analytics?
Embedded Analytics is an approach to simplify Business Intelligence by embedding it directly into operational applications and business processes. Embedded analytics is using the reporting and analytic capabilities in transactional business applications.
What are the Top Embedded Analytics Business Intelligence Software?
Sisense, ThoughtSpot, GoodData, Datapine Business Intelligence, MicroStrategy, JReport, Birst BI, WebFOCUS Platform, SAP BusinessObjects BI, Oracle Business Intelligence, Qlik Sense Enterprise, SAP Crystal Reports, Dundas BI, Tableau Server, Exago Business Intelligence, Yellowfin, Cluvio, BIME Analytics, SAS Enterprise BI Server, Zoomdata, Izenda, TARGIT Decision Suite, Logi Analytics, Chartio, HelicalInsight, icCube, Panintelligence are some of the Top Embedded Analytics Business Intelligence Software.