
Top 41 Free Data Analysis Software

Data Analysis is the process of inspecting, cleaning, transforming, and modeling data with the goal of discovering useful information, suggesting conclusions, and supporting decision making.
For an organization to excel in its operation, it has to make a timely and informed decision. More often than not, decision making relies on the available data. What does this mean? Data alone is not enough; to get the best out of your data, you must ensure that it is authentic. For data to be authentic it has to be current, accurate, and reliable.
The hardest part for any organization is the retrieval and analysis of relevant data in order to gain important business insight that can be used in decision making. To effectively analyze data, most organizations are now shifting their focus to data analysis software. With advancement in technology, software developers have come up with modern data analysis software that makes it easy to retrieve, interact, and visualize the available data with an aim of improving delivery of goods and services.
What are the Top Free Data Analysis Software: Orange Data mining, Anaconda, R Software Environment, Scikit-learn, Weka Data Mining, Shogun, Tableau Public, DataMelt, Microsoft R, Trifacta, SciPy, ELKI, KNIME Analytics Platform Community, Scilab, TANAGRA, Dataiku DSS Community, DataPreparator, ITALASSI, HP Vertica Advanced Analytics, Google Fusion Tables, NodeXL, Fluentd, Displayr, NumPy, OpenRefine, Julia, Massive Online Analysis, DataWrangler, EasyReg, Matplotlib, Ipython, SymPy, FreeMat, jMatLab, PAW, ILNumerics, ROOT, NetworkX, Arcadia Data Instant, SIGVIEW, Gephi are some of the free or open source top software for data analysis.
What are Data Analysis Software?
Data Analysis Software tool that has the statistical and analytical capability of inspecting, cleaning, transforming, and modelling data with an aim of deriving important information for decision-making purposes. The software allows one to explore the available data, understand and analyze complex relationships. Besides statistical analysis, the tool also has a powerful visualization capability which allows one to share the data with other stakeholders.
Data analysis can be classified into descriptive statistics, exploratory data analysis (EDA), and confirmatory data analysis (CDA). Descriptive Statistics deals with quantitatively describing the main features of a collection of information. Exploratory Data Analysis focuses on discovering new features in the data.Confirmatory Data Analysis deals with confirming or falsifying existing hypotheses.
Top Free Data Analysis Software
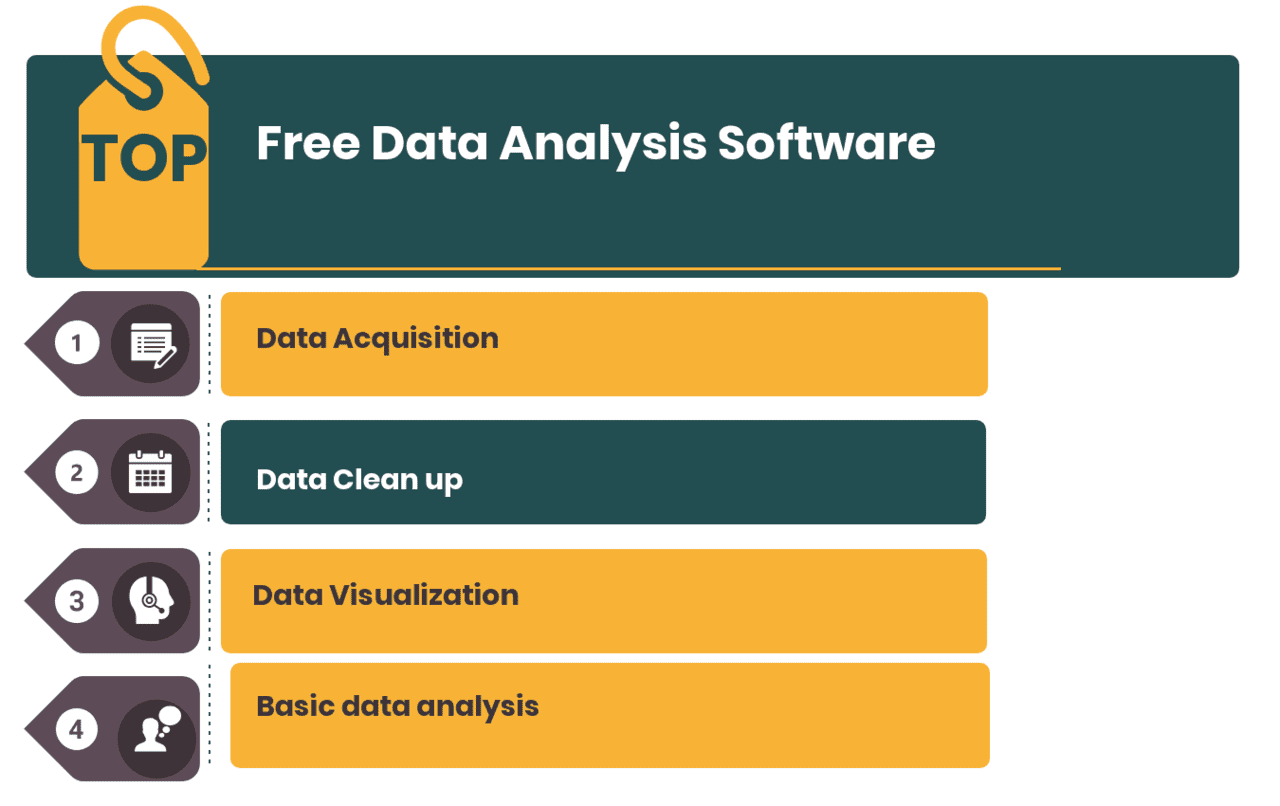
- Data acquisition: Allows one to import data from various sources using import wizard. By importing the data, you can easily carry out the analysis by use of query builder. All you need is to identify your primary table and secondary tables. From there the query builder will automatically match primary key from your primary table with the primary key in the secondary tables thus saving you time.
- Data clean up: For data analysis to be effective, you must have clean and reliable data. The software has features that make it easy to clean up the data and make it more reliable for analysis. Besides clean up, the software can also be used to consolidate different categories from multiple entries for accurate tabulation.
- Data visualization: This is a powerful tool that allows one to identify patterns and trends from a data setup. The tool makes it easy to explore data from different formats ranging from graphs or pie charts. The graph builder helps one to explore the data and build interactive graphical displays with ease. You can also combine multiple graphs for easy and insightful analysis of your data.
- Basic data analysis: By use of a distribution platform, the software makes it easy for you to generate a statistical analysis from the available data. You can easily create interactive histograms and come up with customized summary statistics from the distribution platform. All you need is to identify your column of interest and the distribution platform will automatically generate graphs and other statistics as per your specification.
- Text exploration: Analysing data from text format can be daunting especially if you don’t have the right tools. This is more so because the data is unstructured and at times it can also be uncompromising and unruly. The text explorer feature has a set of highly interactive commands that make it possible to extract words and phrases from the unstructured texts, especially from surveys and engineering notes.
You may also like to review the top free data mining software list :
Top Free Data Mining Software
You may also like to review the top proprietary data mining software list:
Top Data Mining Software
Top Free Data Analysis Software


Orange Data mining
Orange is an open source data visualization and analysis tool. Orange is developed at the Bioinformatics Laboratory at the Faculty of Computer and Information Science, University of Ljubljana, Slovenia, along with open source community. Data mining is done through visual programming or Python scripting. The tool has components for machine learning, add-ons for bioinformatics and text mining and it is packed with features for data analytics. Orange is a Python library. Python scripts can run in a terminal window, integrated environments like PyCharm and PythonWin, or shells like iPython. Orange consists of a canvas interface onto which the user places…
• Open Source
• Interactive Data Visualization
• Visual Programming
• Supports Hands-on Training and Visual Illustrations
• Add-ons Extend Functionality
Free
• Open Source
• Interactive Data Visualization
• Visual Programming
•For everyone- beginners and professionals
•Execute simple and complex data analysis
•Create beautiful and interesting graphics
Anaconda
Anaconda is an open data science platform powered by Python. The open source version of Anaconda is a high performance distribution of Python and R and includes over 100 of the most popular Python, R and Scala packages for data science. There is also access to over 720 packages that can easily be installed with conda, the package, dependency and environment manager, that is included in Anaconda. Includes the most popular Python, R & Scala packages for stats, data mining, machine learning, deep learning, simulation & optimization, geospatial, text & NLP, graph & network, image analysis. Featured packages include: NumPy,…
• Analytics Workflows
• Analytics Interaction
• High Performance Distribution
• Data Engineering
• Advanced Analytics
• High Performance Scale Up
• Reproducibility
• Analytics Deployment
Contact for Pricing
• Analytics Workflows
• Analytics Interaction
• High Performance Distribution
• Accelerate streamline of data science workflow from ingest through deployment
• Connect all data sources to extract the most value from data
• Create, collaborate and share with the entire team
R Software Environment
R is a free software environment for statistical computing and graphics. It compiles and runs on a wide variety of UNIX platforms, Windows and MacOS. R is an integrated suite of software facilities for data manipulation, calculation and graphical display. Some of the functionalities include an effective data handling and storage facility, a suite of operators for calculations on arrays, in particular matrices, a large, coherent, integrated collection of intermediate tools for data analysis, graphical facilities for data analysis and display either directly at the computer or on hardcopy, and well developed, simple and effective programming language which includes conditionals,…
• Open Source - Free Software
• Provides a wide variety of Statistical (linear and nonlinear modeling, classical statistical tests, time-series analysis, classification, clustering) and Graphical Techniques
• Effective data handling and storage facility
• Suite of operators for calculations on arrays, in particular matrices
• Large, coherent, integrated collection of intermediate tools for data analysis
• Graphical facilities for data analysis and display either on-screen or on hardcopy
• Well-developed, simple and effective programming language which includes conditionals, loops, user-defined recursive functions and input and output facilities
Free
• Open Source - Free Software
• Provides a wide variety of Statistical (linear and nonlinear modeling, classical statistical tests, time-series analysis, classification, clustering) and Graphical Techniques
• Effective data handling and storage facility
• Brings analytics to your data
• Runs on a wide variety of platforms- UNIX, Windows, MacOS
• Widely used statistical software
Scikit-learn
Scikit-learn is an open source machine learning library for the Python programming language.It features various classification, regression and clustering algorithms including support vector machines, random forests, gradient boosting, k-means and DBSCAN, and is designed to interoperate with the Python numerical and scientific libraries NumPy and SciPy. Classification : Identifying to which category an object belongs to Applications: Spam detection, Image recognition. Algorithms: SVM, nearest neighbors, random forest. Regression : Predicting a continuous-valued attribute associated with an object. Applications: Drug response, Stock prices. Algorithms: SVR, ridge regression. Clustering :Automatic grouping of similar objects into sets. Applications: Customer segmentation, Grouping experiment outcomes.…
Weka Data Mining
Weka is a collection of machine learning algorithms for data mining tasks. The algorithms can either be applied directly to a dataset or called from your own Java code. Weka features include machine learning, data mining, preprocessing, classification, regression, clustering, association rules, attribute selection, experiments, workflow and visualization. Weka is written in Java, developed at the University of Waikato, New Zealand. All of Weka's techniques are predicated on the assumption that the data is available as a single flat file or relation, where each data point is described by a fixed number of attributes Weka provides access to SQL databases…
• Data Pre-Processing
• Data Classification
• Data Regression
• Data Clustering
• Data Association rules
• Data Visualization
Free
• Data Pre-Processing
• Data Classification
• Data Regression
•Portable
•Free to use
•Easy to use
Shogun
Shogun is a free, open source toolbox written in C++. It offers numerous algorithms and data structures for machine learning problems. The focus of Shogun is on kernel machines such as support vector machines for regression and classification problems. Shogun also offers a full implementation of Hidden Markov models. The toolbox seamlessly allows to easily combine multiple data representations, algorithm classes, and general purpose tools. This enables both rapid prototyping of data pipelines and extensibility in terms of new algorithms. It now offers features that span the whole space of Machine Learning methods, including many classical methods in classification, regression,…
• Free software, community-based development and machine learning education
• Supports many languages from C++, Python, Octave, R, Java, Lua, C#, Ruby, Etc.
• Runs natively under Linux/Unix, Macos, and Windows
• Provides efficient implementation of all standard ml algorithms
• Libsvm/Liblinear, Svmlight, Libocas, Libqp, Vowpalwabbit, Tapkee, Slep, Gpml and more
Free
• Free software, community-based development and machine learning education
• Supports many languages from C++, Python, Octave, R, Java, Lua, C#, Ruby, Etc.
• Runs natively under Linux/Unix, Macos, and Windows
•Completely free to use
•Goes on many operating systems
•Works on different platforms
Tableau Public
Tableau Public is a free data storytelling application used to create and share interactive charts and graphs, stunning maps, live dashboards and fun applications and publish it anywhere on the web. Tableau Public is a free service that lets anyone publish interactive data to the web. Tableau Public includes a free desktop product which can be downloaded and use to publish interactive data visualizations to the web. There is a 10 gigabyte limit on storage space for data. Tableau Public can connect to Microsoft Excel, Microsoft Access, and multiple text file formats. There is a limit of 1,000,000 rows of…
•Create interactive graphs, stunning maps
•Create Live dashboards in minutes
•Save your viz to your Tableau Public profile, and share it anywhere on the web
•Automatic mobile layouts
•Connect directly from Tableau Public to Google Sheets
•Visualization can be embedded
•Mapping experience with vector-based maps.
•Build presentation-ready dashboards
•Content saved to Tableau Public is accessible to everyone on the internet.
•Create interactive graphs, stunning maps, and live dashboards in minutes
•Visually stunning and effectively highlight your analysis
DataMelt
DataMelt, or DMelt, is a software for numeric computation, statistics, analysis of large data volumes ("big data") and scientific visualization. The program can be used in many areas, such as natural sciences, engineering, modeling and analysis of financial markets. DMelt is a computational platform. It can be used with different programming languages on different operating systems. Unlike other statistical programs, it is not limited by a single programming language. DMelt can be used with several scripting languages, such as Python/Jython, BeanShell, Groovy, Ruby, as well as with Java. Most comprehensive software. It includes more than 30,000 Java classes for computation…
•DMelt with all jar libraries and IDE. Mixed GPL and non-GPL licences (180 MB size)
•Online manual (basic introduction)
•Access to Java API of DMelt core library (600 classes)
•Community forum and bug tracker
•Updates of separate jar files via DMelt IDE NO YES YES
•Full version of DMelt manual
•Access to Java API (30,000 classes) with full search
•Access to Image gallery with code examples
•Web access to more than 500 DMelt examples with searchable database
Many features are free. For all the features the user must pay for memebership.
•DMelt with all jar libraries and IDE. Mixed GPL and non-GPL licences (180 MB size)
•Online manual (basic introduction)
•Access to Java API of DMelt core library (600 classes)
•Access to Java API of DMelt core library
•Community forum and bug tracker
•Access to Image gallery with code examples
Microsoft R
R is the world’s most powerful, and preferred, programming language for statistical computing, machine learning, and graphics, and is supported by a thriving global community of users, developers, and contributors.The Microsoft R product family includes: Microsoft R Server, Microsoft R Client, Microsoft R Open, SQL Server R Services. Microsoft R Server is the most broadly deployable enterprise-class analytics platform for R . Supporting a variety of big data statistics, predictive modeling and machine learning capabilities, R Server supports the full range of analytics exploration, analysis, visualization and modeling based on open source R. Microsoft R Client is a free, community…
• Bring analytics to your data
• Build artificial intelligence-enabled apps
• Experience enhanced, flexible deployment
• Adapt to future needs
• Choose the tools you prefer
• Scale R analytics for big data
• Access the latest innovations
• Get support you trust
Contact for Pricing
• Bring analytics to your data
• Build artificial intelligence-enabled apps
• Experience enhanced, flexible deployment
• Bring analytics to your data.
• Build artificial intelligence-enabled apps.
• Choose the tools you prefer.
Trifacta
Trifacta, helps individuals and organizations unlock the potential of their data by providing a new approach to how data is explored and prepared for analysis. Whether you’re trying to improve the efficiency of an existing analysis process or utilize new sources of data for an analytics initiative, Trifacta’s data wrangling solutions will empower you to do more with data of all shapes and sizes. Trifacta’s Visual Data Profiling features provide immediate visibility into unique elements of the data set like data distributions and outliers to inform the transformation and analysis process.Trifacta uses data inference techniques to introspect the data and…
SciPy
SciPy Stack, is a collection of open source software for scientific computing in Python, and particularly a specified set of core packages. SciPy is an open source and free python based software used for technical computing and scientific computing. SciPy is commonly used in solving science, engineering and mathematics problems. SciPy features core packages that provide computing tools for Python. The first package is the Python whose general purpose is acting as the programming language in SciPy. The python provides users with an interactive interface with the ability of interpretation and dynamically typing and suited for interactive work and fast…
• Python
• NumPy
• SciPy library
ELKI
The ELKI framework is written in Java and built around a modular architecture. Most currently included algorithms belong to clustering, outlier detection and database indexes. A key concept of ELKI is to allow the combination of arbitrary algorithms, data types, distance functions and indexes and evaluate these combinations. When developing new algorithms or index structures, the existing components can be reused and combined. ELKI is modeled around a database core, which uses a vertical data layout that stores data in column groups (similar to column families in NoSQL databases). This database core provides nearest neighbor search, range/radius search, and distance…
• Open source data mining software
• High performance and scalability
• Simple visualization window
• Data management tasks
• Standard Java API
Free
• Open source data mining software
• High performance and scalability
• Simple visualization window
• JAVA data mining software
• Allows R code
• Data mining and data management are worked as separate tasks
KNIME Analytics Platform Community
KNIME Analytics Platform is the leading open solution for data-driven innovation, helping you discover the potential hidden in your data, mine for fresh insights, or predict new futures. With more than 1000 modules, hundreds of ready-to-run examples, a comprehensive range of integrated tools, and the widest choice of advanced algorithms available, KNIME Analytics Platform is the perfect toolbox for any data scientist. A vast arsenal of native nodes, community contributions, and tool integrations makes KNIME Analytics Platform the perfect toolbox for any data scientist. https://www.youtube.com/watch?v=fw0Vb2gLsgA
• Powerful Analytics
• Data & Tool Blending
• Open Platform
• Over 1000 Modules and Growing
•Connectors for all major file formats and databases
•Support for a wealth of data types: XML, JSON, images, documents, and many more
•Native and in-database data blending & transformation
•Math & statistical functions
•Advanced predictive and machine learning algorithms
•Workflow control
•Tool blending for Python, R, SQL, Java, Weka, and many more
•Interactive data views & reporting
Free
•Native and in-database data blending & transformation
•Math & statistical functions
•Advanced predictive and machine learning algorithms
• Churn analysis
• Social media sentiment analysis
• Credit scoring
KNIME Analytics Platform Community
Scilab
Scilab is an interpreted programming language that is associated to a detailed collection of numerical algorithms that solve many aspects of scientific problems. Users do not pay for Scilab therefor making it a free software. The binaries used in Scilab provide users with a good platform to process the 32 and 64-bit type of data. Scilab has main features that enable users interact more and easily with Scilab. They include optimization, statistics, maths and simulation, signal processing, application development, 2-D and 3-D visualization and the control system design and analysis. Scilab through the signal processing feature provides users with the…
• Optimization
• Statistics
• Signal processing
• Application development
• Maths and Simulation
• 2-D and 3-D visualization
• Control system design and analysis
• Free
• Application development
• Maths and Simulation
• 2-D and 3-D visualization
TANAGRA
Tanagra represents free data mining software for academic and research purposes. It provides several data mining methods from exploratory data analysis, statistical learning, machine learning and databases area. It is a successor of SIPINA which means that various supervised learning algorithms are provided, especially an interactive and visual construction of decision trees. Because it contains supervised learning but also other paradigms such as clustering, factorial analysis, parametric and nonparametric statistics, association rule, feature selection and construction algorithms, Tanagra is very powerful. The main goal of this project is giving researchers and student’s easy-to-use data mining software and second goal is…
•Free data mining software for academic and research purposes
•Provides several data mining methods from exploratory data analysis, statistical learning, machine learning and databases area
•Acts more as an experimental platform
•Open source project
Free
•Free data mining software for academic and research purposes
•Provides several data mining methods from exploratory data analysis, statistical learning, machine learning and databases area
•Acts more as an experimental platform
• Easy to use data mining software
• Interactive utilization
• A wide set of data sources
Dataiku DSS Community
Dataiku DSS is the collaborative data science software platform for teams of data scientists, data analysts, and engineers to explore, prototype, build, and deliver their own data products more efficiently. Dataiku develops the unique advanced analytics software solution that enables companies to build and deliver their own data products more efficiently. Dataiku DSS is a collaborative and team-based user interface for data scientists and beginner analysts, to a unified framework for both development and deployment of data projects, and to immediate access to all the features and tools required to design data products from scratch. The visual interface of Dataiku…
•Data connectors
•Data transformation
•Transformation engines
•Data Visualization
•Data Mining
•Machine Learning
Free
•Data connectors
•Data transformation
•Transformation engines
•Connect to more than 25 data storage systems
•Extend with plugins
•Visualize and re-run Workflows
DataPreparator
DataPreparator is a free software tool which is designed to assist with common tasks of data preparation (or data preprocessing) in data analysis and data mining. DataPreparator offers features such as character removal, text replacement, date conversion, remove selected attributes, move selected attributes, equal width, equal frequency, equal frequency from grouped data, delete records containing missing values, remove attributes containing missing values, impute missing values, predict missing values from model (dependence tree, Naive Bayes model), include missing value patterns, Z-score metho. Box-plot method, create binary attributes, replace nominal values by indices, reduce number of labels, decimal, linear, hyperbolic tangent, soft-max,…
• Data access from text files, relational databases, and Excel workbooks
• Handling of large volumes of data (since data sets are not stored in the computer memory, with the exception of Excel workbooks and result sets of some databases where database drivers do not support data streaming)
• Stand alone tool, independent of any other tools
• User friendly graphical user interface
• Operator chaining to create sequences of preprocessing transformations (operator tree)
• Creating of model tree for test/execution data
• Free
• Data access from text files, relational databases, and Excel workbooks
• Handling of large volumes of data (since data sets are not stored in the computer memory, with the exception of Excel workbooks and result sets of some databases where database drivers do not support data streaming)
• Stand alone tool, independent of any other tools
• Provides a variety of techniques for data cleaning, transformation, and exploration
• Chaining of preprocessing operators into a flow graph (operator tree)
• Handling of large volumes of data (since data sets are not stored in the computer memory)
ITALASSI
ITALASSI is a freeware program which facilitate interpretation of regression models (2 independent variables) with an interaction term. The program allows you to enter several regression models (two bivariate, one multiple additive, and one multivariate with interaction) in the form of equations or compute those equations from raw data and displays the various models using 2D and 3D graphs. The program may also be used in advanced stat courses to illustrate statistical interactions or applied multiple regression.
•Interpretation of regression models (2 independent variables)
•Enter several regression models (two bivariate, one multiple additive, and one multivariate with interaction)
•2D and 3D graphs
Free
•Interpretation of regression models (2 independent variables)
•Enter several regression models (two bivariate, one multiple additive, and one multivariate with interaction)
•2D and 3D graphs
• Improved 3D rotation
•Can perform analysis on SPSS for Windows .SAV files
•Interpretation of regression models
HP Vertica Advanced Analytics
Vertica Advanced Analytics manages and organizes data for businesses users. It analyzes data quickly and rapidly. The software can manage both structured and semi structured data. HPE Vertica is the most advanced SQL database analytics portfolio built from the very first line of code to address the most demanding Big Data analytics initiatives. HPE Vertica delivers speed without compromise, scale without limits, and the broadest range of consumption models. Choose Vertica on premise, in the cloud, or on Hadoop. With support for all leading BI and visualization tools, open source technologies like Hadoop and R, and built-in analytical functions, Vertica…
• Parallel approach to big data
• Faster data loads and higher concurrency
• Flexibility and scalability
• Columnar storage
• Intelligent compression
• Deploy on premise, in the clouds, and on Hadoop
• Complete and advanced SQL-based analytical functions
• Certification for common ETL and visualization tools
• Geospatial and other advanced analytic functions
• Machine learning models including regression and K-means that you can predict and share with spark
• Integration with Hadoop, including parquet and ORC files
Contact for Pricing
• Parallel approach to big data
• Faster data loads and higher concurrency
• Flexibility and scalability
• Ability to deploy anywhere.
• Proactive and predictive analytics.
• Placed analysis through open source integration.
Google Fusion Tables
Fusion Tables is a web application for visualizing data that allows users to share data sets and combine them together to build data visualization online. The application is still experimental and its API has released V2. It allows users to easily create data visuals and publish them online instantly with provided subsets and an easy format similar to online files. Fusion Tables supports the ability to work through larger data sets including filtering, sorting, summarizing them in collaboration with other users online. Fusion Tables lets users combine multiple tables between users and publicly available data then merge them into one…
• Visualize Bigger Data Tables Online
• Merge multiple tables into one visualization
• Make a map in minutes
• Host Data Online
•Professional Edition - $4,500/year
•Enterprise edition - $22,000/year
• Visualize Bigger Data Tables Online
• Merge multiple tables into one visualization
• Make a map in minutes
NodeXL
NodeXL is a graphic application of networks. NodeXL comes in two packages; basic and pro. Basic is free, and the NodeXL application is available for Microsoft® Excel® 2007, 2010, 2013 and 2016 which makes exploration of network graphs easy. NodeXL pro, on the other hand, extends features of the basic NodeXL and provides additional features such as access to social media network data streams, text analysis as well as sentiment analysis and advanced network metrics. Both the basic and pro-NodeXL features Graph Metric Calculations, the only difference is that the pro can calculate the degree of centrality, PageRank, clustering coefficient…
•Graph Metric Calculations
•Flexible Import and Export
•Direct Connections to Social Networks
•Zoom and Scale
•Flexible Layout
•Easily Adjusted Appearance
•Dynamic Filtering
•Powerful Vertex Grouping
•Task Automation
Free
•Graph Metric Calculations
•Flexible Import and Export
•Direct Connections to Social Networks
Fluentd
Fluentd is an open source data collector, which lets you unify the data collection and consumption for a better use and understanding of data. Fluentd offers features such as a community-driven support, ruby gems installation, self-service configuration, OS default Memory allocator, C & Ruby language, 40mb memory, requires a certain number of gems and Ruby interpreter and more than 650 plugins available. Fluentd tries to structure data as JSON as much as possible which allows Fluentd to unify all facets of processing log data such as collecting, filtering, buffering, and outputting logs across multiple sources and destinations (Unified Logging Layer).…
• Unified Logging with JSON
• Pluggable Architecture
• Minimum Resources Required
• Built-in Reliability
• Free
• Unified Logging with JSON
• Pluggable Architecture
• Minimum Resources Required
• Fluentd decouples data sources from backend systems by providing a unified logging layer in between.
• Simple and Easy yet Flexible
• Fluentd is Apache 2.0 Licensed
Displayr
Displayr provides building apps that brings data science, visualization, and reporting to everyone. The two main products are Displayr, the world's first complete data science tool; and Q, the complete toolkit for market researchers. Now you can discover the story in your data, and create impressive reports, dashboards and visualizations without the need to reformat your data, have specialist coding knowledge, or involve IT or other outside consultants. Displayr is the only BI tool built specifically with survey data in mind. Displayr makes it easy to connect your data from virtually any source (without complex reformatting) letting you focus on…
• Analyze up to 100 responses per survey
• Easy-to-use web-based analysis tool
• Create tables and charts
• Create word clouds
• Reformat your data
• Interesting results automatically highlighted (significance testing)
• Free
• Basic - $19 per month; Billed $228 annually
• Standard - $25 per month; Billed $300 annually
• The Lot - $65 per month; Billed $780 annually
• Analyze up to 100 responses per survey
• Easy-to-use web-based analysis tool
• Create tables and charts
• Interesting results are automatically highlighted
• Easy and intuitive to use
• You can share your insights
NumPy
NumPy provides a comprehensive package for scientific computing using a python programming language. The NumPy library provides support to big multi-dimensional arrays and matrices. NumPy fully integrated package contains several features that makes it ideal for scientific computing, calculation of multi-dimensional arrays, matrices and even high level mathematics calculations. The first feature of NumPy is the powerful N-dimensional array object that is used in the multi-dimensional arrays. Data scientists and developers performing broadcasting are also sorted out as NumPy provides detailed and easy to use functions. NumPy also provides C or C++ tools to developers and data scientists. The C++…
• Powerful N-dimensional array object
• Sophisticated (broadcasting) functions
• Tools for integrating C/C++ and Fortran code
• Useful linear algebra
• Fourier transform
• Random number
Contact for Pricing
• Tools for integrating C/C++ and Fortran code
• Useful linear algebra
• Fourier transform
• Seamlessly and speedily integrate with a wide variety of databases
• Defines data types
• Efficient multi-dimensional container for generic data
OpenRefine
OpenRefine is a sophisticated tool for working on big data and perform analytics. OpenRefine is able to perform various tasks on data. The tasks are, cleaning data, transformation of data from one form into the other format, and also extend with web services and data that are external. OpenRefine provides the explore data feature that enables data scientists go through large data sets with ease. The explore data feature is easy to be used as it also comes with a video explaining how it is used. The clean and transform data feature provided by OpenRefine enables data scientists also clean…
• Explore data
• Clean and transform data
• Reconcile and match data
• General Refine Expression Language
Contact for Pricing
• Explore data
• Clean and transform data
• Reconcile and match data
• Import data in various formats
• Explore datasets in a matter of seconds
• Apply basic and advanced cell transformations
Julia
Julia is a sophisticated programming language that is of high performance used for numerical computation. Julia provides a comprehensive compiler, parallel execution that is distributed, a function library that is extensive mathematically and numerical accuracy. All of Julia programs encircle several dispatches by defining and compiling up functions used in argument types of different combinations which in other cases can be defined by the user. The multiple dispatch provides scientists with the ability of defining function behaviors across several combinations of arguments. Julia also features a dynamic type system which is able to deal with various types of documentation, dispatch,…
• Dynamic type system
• Multiple dispatch
• Built-in package manger
• Call Python functions
• Call C functions directly
Contact for Pricing
• Provides distributed parallel execution
• Provides library for random number generation
• Ability to overload different combinations of argument types
Massive Online Analysis
Massive Online Analysis (MOA) is a framework that is open source used in stream mining of data. Massive Online Analysis consists of a collection of machine learning algorithms such as regression, classification, clustering, detection, outlier, recommender systems, and concept drift detection. Massive Online Analysis also features tools used in evaluation of data stream mining. Massive Online Analysis is ideal for data scientists as it performs big data stream mining in real time and also perform large scale machine learning. The mining algorithms available in MOA can be extended and achieve new stream generators or evaluation measures. Massive Online Analysis features…
•Machine learning algorithms (classification, regression, clustering, outlier detection, concept drift detection and recommender systems) and tools for evaluation.
•Stream mining in real time, and large scale machine learning.
Contact for Pricing
•Machine learning algorithms (classification, regression, clustering, outlier detection, concept drift detection and recommender systems) and tools for evaluation.
•Stream mining in real time, and large scale machine learning.
• Easily used with Apache Flink, Apache Storm, S4 or Samza
• Handles complex knowledge workflows
• Enables multi-label classification
DataWrangler
DataWrangler is a web-based service which is designed for cleaning and rearranging data so it is in a form that other tools such as a spreadsheet app can use. DataWrangler offers features such as exports transformation script as code which is a useful option for handling large data sets where the users first transform a sample of their data in the Wrangler interface, then run the resulting script on the full data set and supports output scripts in two languages such as Python (for data-crunching on the back end) and JavaScript (for transforming in the browser, or using node.js). DataWrangler…
• Designed to accelerate analysis and visualization tools
• Interactive transformation of messy, real-world data into the data tables analysis tools expect.
• Export data for use in Excel, R, Tableau, Protovis
Free
• Designed to accelerate analysis and visualization tools
• Interactive transformation of messy, real-world data into the data tables analysis tools expect.
• Export data for use in Excel, R, Tableau, Protovis
EasyReg
EasyReg is an open source software that conducts several testing tasks and econometric estimation on all Windows platforms that use 32 and 64 bit form and also the Windows 7. Users using Windows 8 are also able to use EasyReg by only setting EasyReg compatibility mode to Windows XP. EasyReg is programmed to be able to work in Visual Basic 5 and also Visual Basic 5 Enterprise Edition. EasyReg is configured to be used in teaching econometrics and empirical research. The software is referred to as international because it is able to accept commas and dots as delimiters in decimal…
•Tabulating data.
•Calculating summary statistics of the data: sample mean and standard error, minimum, maximum
•Plotting time series.
•Drawing scatter diagrams.
•Kernel estimation of univariate and bivariate density functions (two versions: standard kernel density estimation, and •Bierens' SMINK estimation).
•Auto- and cross-correlation functions for time series. In the autocorrelation case also the Box-Pierce Q statistics, •Ljung-Box Q statistics, and the partial autocorrelations can be computed.
•Periodogram of a time series
• Free
•Tabulating data.
•Calculating summary statistics of the data: sample mean and standard error, minimum, maximum
•Plotting time series.
Matplotlib
Matplotlib is a library for making 2D plots of arrays in Python which produces publication quality figures in a variety of hardcopy formats and interactive environments across platforms. Matplotlib offers features such as The top level matplotlib module, afm (Adobe Font Metrics interface), animation module, artist Module, Axes class, axis and tick API, backends, cbook, cm (colormap), collections, colorbar, colors, container, dates, dviread, figure, finance, font_manager, gridspec, image, legend and legend_handler, lines, markers, mathtext, mlab, offsetbox, patches, path, patheffects, projections, pyplot, rcsetup, Sankey, scale, spines, style, text, ticker, tight_layout, working with transformations, triangular grids, type1font, units and widgets. Users can…
• Improved color conversion API and RGBA support
• New Configuration (rcParams)
• Qualitative colormaps
• Axis offset label now responds to labelcolor
• Improved offset text choice
• Style parameter blacklist
• Change in default font
• Faster text rendering
• Improvements for the Qt figure options editor
• Improved image support
• Support for HiDPI (Retina) displays in the NbAgg and WebAgg backends
• Change in the default animation codec
• Deprecated support for mencoder in animation
• Boxplot Zorder Keyword Argument
• Filled + and x markers
• rcount and ccount for plot_surface()
• Streamplot Zorder Keyword Argument Changes
• Extension to matplotlib.backend_bases.GraphicsContextBase
• Free
• Improved color conversion API and RGBA support
• New Configuration (rcParams)
• Qualitative colormaps
• Produces publication quality figures
• Can be used in python scripts
• Generate plots
Ipython
IPython is open source (BSD license) which provides an easy to use, high performance tools for parallel computing. IPython offers features such as Jupyter notebook and notebook file format, Jupyter Qt console, kernel messaging protocol, ipyparallel (formerly IPython.parallel), ipykernel (minimal docs, only release notes for the ipykernel package), ipywidgets (formerly IPython.html.widgets), Traitlets, the config system used by IPython and Jupyter, interactive interpreter, an enhanced interactive Python shell, a decoupled two-process communication model and an architecture for interactive parallel computing. IPython is known to work on Linux, Most other Unix-like OSs (AIX, Solaris, BSD), Mac OS X and Windows (CygWin, XP,…
• A powerful interactive shell.
• A kernel for Jupyter.
• Support for interactive data visualization and use of GUI toolkits.
• Flexible, embeddable interpreters to load into your own projects.
• Easy to use, high performance tools for parallel computing.
• Free
• Support for interactive data visualization and use of GUI toolkits.
• Flexible, embeddable interpreters to load into your own projects.
• Easy to use, high performance tools for parallel computing.
• Provides a rich architecture for interactive computing
• Used by a range of other projects
• Add your project to that list if it uses Ipython as a library
SymPy
SymPy is a Python library for symbolic mathematics which simplifies expressions, compute derivatives, integrals, and limits, solve equations and work with matrices. SymPy includes features such as modules for plotting such as coordinate modes, Plotting Geometric Entities, 2D and 3D, Interactive interface, Colors and Matplotlib support, printing like 2D pretty printed output of math formulas, or LATEX, code generation, physics, statistics, combinatorics, number theory, geometry and logic, Conversion from Python objects to SymPy objects, Optional implicit multiplication and function application parsing, Limited Mathematica and Maxima parsing: example on SymPy Live and Custom parsing transformations and Shift cipher, Affine cipher, Bifid…
• Basic arithmetic: Support for operators such as +, -, *, /, ** (power)
• Simplification Trigonometry, Polynomials
• Expansion: of a polynomial
• Functions: trigonometric, hyperbolic, exponential, roots, logarithms, absolute value, spherical harmonics, factorials and gamma functions, zeta functions, polynomials, special functions
• Numbers: arbitrary precision integers, rationals, and floats
• Noncommutative symbols
• Pattern matching
• Free
• Basic arithmetic: Support for operators such as +, -, *, /, ** (power)
• Simplification Trigonometry, Polynomials
• Expansion: of a polynomial
• Licensed under BSD
• Written entirely in Python
• Uses Python for its language
FreeMat
FreeMat is an environment for rapid engineering and scientific processing which is similar to commercial systems such as MATLAB from Mathworks and IDL from Research Systems, but is Open Source. FreeMat offers features such as a codeless interface to external C/C++/FORTRAN code, parallel/distributed algorithm development (via MPI), and advanced volume and 3D visualization capabilities. FreeMat now supports function handles, or function pointers where a function handle is an alias for a function or script that is stored in a variable. FreeMat now also supports the so called dynamic-field indexing expressions where the fieldname is supplied through an expression instead of…
• N-dimensional array manipulation (by default, N is limited to 6)
• Support for 8,16, and 32 bit integer types (signed and unsigned), 32 and 64 bit floating point types, and 64 and 128 bit complex types.
• Built in arithmetic for manipulation of all supported data types.
• Support for solving linear systems of equations via the divide operators.
• Eigenvalue and singular value decompositions
• Full control structure support (including, for, while, break, continue, etc.)
• 2D plotting and image display
• Heterogeneous array types (called "cell arrays" in MATLAB-speak) fully supported
• Full support for dynamic structure arrays
• Split-radix based FFT support
• Pass-by-reference support (an IDL feature)
• Keyword support (an IDL feature)
• Codeless interface to external C/C++/FORTRAN code
• Native Windows support
• Native sparse matrix support
• Native support for Mac OS X (no X11 server required).
• Function pointers (eval and feval are fully supported)
• Classes, operator overloading
• 3D Plotting and visualization via OpenGL
• Handle-based graphics
• 3D volume rendering capability (via VTK)
• Free
• N-dimensional array manipulation (by default, N is limited to 6)
• Support for 8,16, and 32 bit integer types (signed and unsigned), 32 and 64 bit floating point types, and 64 and 128 bit complex types.
• Built in arithmetic for manipulation of all supported data types.
• FreeMat is now easier to build.
• The top level README.TXT includes instructions on how to build FreeMat on all three platforms (Linux, Mac OS X, and Mingw32).
• Documentation has been migrated to doxygen.
jMatLab
jMatLab is a free platform for mathematical and numerical computations which is a clone of Matlab and Octave and runs on any platform where Java is installed or on the Web browser. jMatLab provides features such as Arithmetic, Variables, String Manipulations, Commands and Operators, Functions, Polynomials, Vectors, Differentiation, Equations (Differential), Equations (Linear Systems), Equations (Nonlinear), Equations (Nonlinear Systems), Indefinite Integrals, Input and Output, Matrices, Numerical Integration, Plots, Programming, Statistics (Data Fitting), Statistics (Descriptive), Statistics (Histograms), Statistics (Random Numbers), Taylorpolynomial and Transformations. jMathLab has its own help system where all programming modules are arranged in groups and users can list all…
• Used for Symbolic calculations
• Numeric Evaluation of mathematical functions, special functions
• Linear algebra with vectors and matrices
• Displaying data, vectors, matrices and functions using 2D and 3D interactive plots
• Saving data in CSV files
• Random numbers using the major distributions
• Solving linear and non-linear equations and systems of equations
• Basic statistical calculations and histogramming
• Free
• Used for Symbolic calculations
• Numeric Evaluation of mathematical functions, special functions
• Linear algebra with vectors and matrices
• A clone of Matlab and Octave
• Runs on any platform where Java is installed
• Can also run on the Web browser
PAW
PAW is an instrument conceived for assisting physicists in analyzing and presenting of data. PAW facilitates an statistical or mathematical analysis and a graphical presentation that are interactive. The interactive graphical presentation enables physicists work on objects familiar to them such as event files, vectors, and histograms. The PAW presentation feature provides a set of slides majorly in PostScript format that provides a general overview of the entire PAW system. The set of slides in PostScript format provides physicists with an almost complete review of the PAW functionalities. The PAW functionalities presented in set if slides in PostScript format are…
• Pawpict package
• PAW presentation
• Neural networks
• WebPAW
• Hints to speed up Ntuple analysis
Contact for Pricing
• Pawpict package
• PAW presentation
• Neural networks
• Easier to include pictures in LaTeX documents
• Able to send commands or execute through any Web browser and receive resulting pictures
• Easy to understand functionalities for people with no knowledge of PAW
ILNumerics
ILNumerics is based on modern software frameworks and provides tools and solutions for scientists and engineers in all industries. ILNumerics modern software framework enables data scientists and engineers to develop and deploy highly configured technical applications in the shortest time possible. ILNumerics features the ILNumerics array visualizer. The array visualizer is simply a graphical watch window used in Visual Studio. The array visualizer enables scientists debug large and big data in a broad range of technical applications. The array visualizer has a visual representation of arbitrary data that enables it prototype your algorithms and find bugs quickly and also have…
• Array visualizer
• Visualization engine
• Computing engine
• Visualization engine - 89,-EUR/Month1
• Computing engine - 89,-EUR/Month1
• Interpolation Toolbox2 - 69,-EUR/Month1
• Optimization Toolbox2 -69,-EUR/Month1
• Statistical Toolbox2- 49.-EUR/Month1
• Machine Learning Toolbox2- 49,EUR/Month1
• HDF5 (Hierarchical Data Format)2- 49,-EUR/Month1
• Drawing2 Plotting Extensions4- 49,-EUR/Month1
• Array visualizer
• Visualization engine
• Computing engine
• No IT expert knowledge needed
• Finds bugs easily
• Eliminates multithreading concurrency issues
ROOT
ROOT is a sophisticated scientific software application that provides functions required to deal with statistical analysis, large data processing, storage, and visualization. ROOT is mainly in C++ language but it can be converted into several natural languages such as R, Python and many more. The Save data feature provided by ROOT enables users to save their data using C++ object language or in a binary form that is compressed in their own file. The ROOT files are self-descriptive therefore making it easy for users to save their object format in the same ROOT file. The ROOT file contains information that…
• Save data
• Access data
• Process data
• Show results
• Integration with other languages
• Interactive or built application
Contact for Pricing
• Process data
• Show results
• Integration with other languages
• Save data in a compressed binary form
• Access data from your PC
• Able to simulate complex systems
NetworkX
NetworkX is a software package in Python language used in creating, manipulating, and study of the functions, structures, and dynamics of the networks that are complex. NetworkX is simply a software ideal for analyzing complex networks. NetworkX enables results to be presented in a unique and graphical way. The data structures are present for graphs, multigraphs, and digraphs. Since NetworkX is a Python package it facilitates fast prototyping and provides an easy to teach and multi-platform. Data scientists are also provided with several standard graph algorithms that are useful when dealing with complex networks. NetworkX also features generators. The generators…
• Many standard graph algorithms
• Edges can hold arbitrary data
• Network structures and analysis measures
• Data structures for graphs, digraphs, and multigraphs
• Generators for classic graphs, random graphs and synthetic networks
Contact for Pricing
• Many standard graph algorithms
• Edges can hold arbitrary data
• Network structures and analysis measures
• Enables creation of complex networks
• Enables manipulation of complex networks
• Enables study of structure of complex networks
Arcadia Data Instant
Arcadia Data Instan uses smart acceleration to enable ultra-fast analytics and BI with agile drag-and-drop access. Arcadia Data Instant provides an in-cluster execution engine for scale-out performance on Apache Hadoop and other modern data platforms with no data movement. Arcadia Data Instant supports visualizations on Apache Kafka. Through this, users have an excellent platform to download a kit quickly and get started with exploring visualizations of Kafka topics. The key features offered by Arcadia Data Instant include connect, discover, model, visualise, interact, manage, scale, optimize, security, share and publish, and advanced analytics. The connect feature allows accessing data inside Hadoop…
• The discover feature provides browse data sources, structure and content, with full granularity and transparency
• Set hierarchies and logical datasets, for blending visualizations across sources
• The visualize feature provides easy to use familiar web-based self-service drag and drop authoring
• Flow and funnel algorithms that make it easy to measure correlation
• Create semantic relationships across multiple sources
• Assemble dashboards and applications of visuals that show the user’s work
Contact for pricing
• The discover feature provides browse data sources, structure and content, with full granularity and transparency
• Set hierarchies and logical datasets, for blending visualizations across sources
• The visualize feature provides easy to use familiar web-based self-service drag and drop authoring
• Provides an in-cluster execution engine for scale-out performance on Apache Hadoop
• Achieve linear scalability of records with native in-cluster execution
• Simplifies deployment and monitoring with certified integration
SIGVIEW
SIGVIEW is a real-time and offline signal analysis software package that includes wide range of powerful signal analysis tools, statistics functions and a comprehensive visualization system. Since it is distributed as a shareware, users can download a completely functional version and even try it for 21 days to establish if it can deliver to the needs of the business. SIGVIEW’s unique and friendly user interface and philosophy provides its users the absolute freedom to combine different signal analysis methods in any possible way, this helps users able to utilize it easier and focus more on how it can help the…
• Various statistics functions
• Custom filter curves can be freely defined and applied directly to time-domain signal or to the calculated spectrum
• Advanced signal display and handling options
• Signal generator
• Support for wide range of data acquisition devices
• Real time data display
• Import and export of signal files in numerous formats: WAV, MP3, ASCII, WMA, AU, AIFF, SND, 8/16/32-bit binary files, EDF...
• Optimized FFT algorithm
• Spectrogram and Time-FFT functions with powerful graphical display solutions
• Dual channel (cross-spectral) analysis
• Signal filtering (Bandstop, Bandpass, Lowpass, Highpass)
• Real-time arithmetics on signals (subtract, multiply, add, scale, normalize...)• Graphical block diagram environment
• Custom tools and workspaces
• Various command-line options for automation and remote control from external applications or from simple batch files
• No artificial or license-based limitations
•SIGVIEW Standard Version
Single Seat License $139.00/month
5-Pack Seat License $490.00/month
10-Pack Seat License $690.00/month
Site License $1290.00/month
•SIGVIEW Educational
5-Pack Seat License $390.00/month
10-Pack Seat License $590.00/month
Site License $1090.00/month
• Support for wide range of data acquisition devices
• Real time data display
• Import and export of signal files in numerous formats: WAV, MP3, ASCII, WMA, AU, AIFF, SND, 8/16/32-bit binary files, EDF...
• Real time data display, signal analysis and control.
• Import and export of signal files in numerous formats.
• Signal filtering.
Gephi
Gephi is a tool for data analysts and scientists keen to explore and understand graphs. Like Photoshop but for graph data, the user interacts with the representation, manipulate the structures, shapes and colors to reveal hidden patterns. The goal is to help data analysts to make hypothesis, intuitively discover patterns, isolate structure singularities or faults during data sourcing. Gephi is an open-source software for network visualization and analysis. It helps data analysts to intuitively reveal trends and patterns, highlight outliers and tells stories with their data. It uses a 3D render engine to display large graphs in real-time and to…
•Networks up to 100,000 nodes and 1,000,000 edges
•Iterate through visualization using dynamic filtering
•Rich tools for meaningful graph manipulation
•Force-based algorithms
•Optimize for graph readability
•Betweenness Centrality, Closeness, Diameter, Clustering Coefficient, PageRank
•Community detection (Modularity)
•Random generators
•Shortest path
•Import temporal graph with the GEXF file format
•Run metrics over time (clustering coefficient)
•Graph streaming ready
•Customizable PDF, SVG and PNG export
•Save presets
• User can interact with the representation
• User can manipulate the structures, shapes and colors to reveal hidden patterns
• User can intuitively discover patterns
Gephi What are Data Analysis Software? Data Analysis Software tool that has the statistical and analytical capability of inspecting, cleaning, transforming, and modelling data with an aim of deriving important information for decision-making purposes. The software allows one to explore the available data, understand and analyze complex relationships. What are the Top Free Data Analysis Software? Orange Data mining, Anaconda, R Software Environment, Scikit-learn, Weka Data Mining, Shogun, Tableau Public, DataMelt, Microsoft R, Trifacta, SciPy, ELKI, KNIME Analytics Platform Community, Scilab, TANAGRA, Dataiku DSS Community, DataPreparator, ITALASSI, HP Vertica Advanced Analytics, Google Fusion Tables, NodeXL, Fluentd, Displayr, NumPy, OpenRefine, Julia, Massive Online Analysis, DataWrangler, EasyReg, Matplotlib, Ipython, SymPy, FreeMat, jMatLab, PAW, ILNumerics, ROOT, NetworkX, Arcadia Data Instant, SIGVIEW, Gephi are some of the free or open source top software for data analysis.


ADDITIONAL INFORMATION
One correction: at the very top, ScaVi should be called “ScaVis”. I should say I like the best SCaVis since I can program in Python while accessing very reach Java numerical libraries.
ADDITIONAL INFORMATION
A related tool for data anlaysis is json-csv.com. It is an online converter which can convert any JSON to CSv for processing within a spreadsheet.