
17 Top Sales Analytics and Sales Intelligence Reporting Software

Sales Analytics is the process of analyzing sales data to identify trends, patterns, and opportunities to improve sales performance. It involves collecting, cleaning, and transforming data from various sources, such as CRM systems, marketing automation systems, and transaction systems, and using various tools and techniques to perform analysis. Sales Analytics helps organizations understand their sales performance, identify strengths and weaknesses, and make data-driven decisions to improve their sales processes and results.
Sales Intelligence refers to the use of data, market insights, and technology to inform and improve sales strategy and performance. It involves gathering information about potential customers, market trends, and competitors to inform sales decisions and tactics. Sales Intelligence helps organizations to better understand their customers and target markets, improve their sales processes, and increase their sales results.
What are Sales Analytics and Sales Intelligence Reporting Software
Sales Management is a crucial aspect of running any business. Sales managers and teams need to rely on fact-based insights to locate the high or the low-performing salespeople and products. It can help them make informed decisions as well as forecast future sales figures. If a sales leader has fact-based sales insights, it can help them improve sales strategies and their sales teams’ actions.
A sales director must have the ability to communicate about the progress of the team and products sales in a detailed and informative way. Sales reports are a key feature of the communication process, and the sales director must have the ability to break sales down into understandable pieces of data to allow businesses examine exactly what is working and what’s not working and what needs improvement.
Sales managers need to compare the performance of their sales team and deliver fact-based arguments in sales meetings. Sales insights help them to serve the right customers faster by giving priority to the most promising projects, design, explore and analyze together new potential sales territories and follow the latest and the most successful sales management practices.
Top Sales Analytics and Sales Intelligence Reporting Software: Sisense, TIBCO Spotfire, SQL Server Reporting Services, Alteryx Analytics, Tableau Desktop, GoodData, Birst BI, MicroStrategy, ClearStory Data, Oracle Business Intelligence, SAP BusinessObjects BI, Salesforce Wave Analytics, Qlik Sense Enterprise, SAS Office Analytics, Vecta, Right90, IBM Sales Performance Management are some of the Top Sales Analytics and Sales Intelligence Reporting Software.
What are Sales Analytics and Sales Intelligence Reporting Software?
Sales Analytics and Sales Intelligence reporting software are specialized tools used to collect, analyze, and visualize sales data and market insights. These tools help sales teams to track and understand their sales performance, identify trends and patterns, and make informed decisions to improve their sales results.
Sales Analytics and Sales Intelligence Reporting deals with comprehensive analytic solution that provides real time, fact-based insight into the entire sales process. Sales Analytics or Sales intelligence refers to technologies, applications and practices for the collection, integration, analysis, and presentation of information to help salespeople keep up to date with clients, prospect data and drive business. Sales Analytics provides real-time analysis of current sales data and assists with suggesting and delivering actionable, relevant information. Sales Analytics provide unique insight into customer buying patterns by automatically analysing and evaluating these patterns, it can pro-actively identifies and delivers up-sell, cross-sell opportunities.
What are Sales Analytics and Sales Intelligence Reporting Software
Sales Analytics Reporting Software reveals sales insights to predict the future performance of the business. It helps the sales director and team to view sales data in different ways, improves sales forecasting, evaluate sales performance more specifically, identify challenges the sales team encounter and manages the sales activities and solve problems before they arise.
You may like to read: What is Reporting Software?, Top Best Practices in Reporting Software and Free, Open Source and Top Reporting Software.
- Centralized Sales Data Management: Sales Analytics and Sales Intelligence Reporting can allow the user to join data from multiple sources in one place.
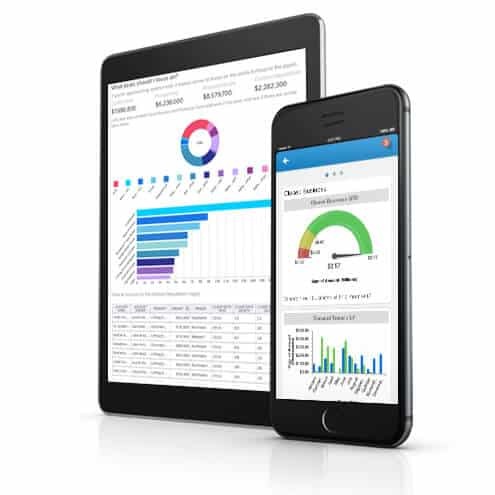
- Mobile accessibility: Sales teams are often in the field and rely on mobile phones to perform their sales functions. Sales Analytics and Sales Intelligence Reporting tools have mobile capabilities to help them accomplish the tasks required while on the go.
- Real-time Data Monitoring: Sales Analytics and Sales Intelligence Reporting enables the user to access up-to-date data that is continuously modified to reflect any changes made.
- Collaboration: Sales Analytics and Sales Intelligence Reporting helps streamline collaboration by allowing the user to share data online. It integrates with other platforms like Google Docs and excel spreadsheet that makes file sharing easier.
- Visualization & Reporting: Sales Analytics and Sales Intelligence Reporting create reports out of the data collected over time and presents it in a visually and comprehensible way.
- Interactive Dashboards: Sales Analytics and Sales Intelligence Reporting have an interactive and easy-to-use interface with drag-and-drop elements to enable the user to navigate the platform quickly.
- Integration with Other Sales Tools: Sales Analytics and Sales Intelligence Reporting helps simplify the workflow of the sales team because instead of having several tools open at a time, they can access all the information from one spot.
- Pipeline management: With pipeline inspection feature, the user can gain visibility into the deal they are working on and can help pinpoint the transactions that are moving forward.
Sales Analytics and reporting software is an essential tool that helps the sales team to gain visibility into all the sales activities and thus make informed decisions and forecast the future performance of the business.
Top Sales Analytics and Sales Intelligence Reporting Software


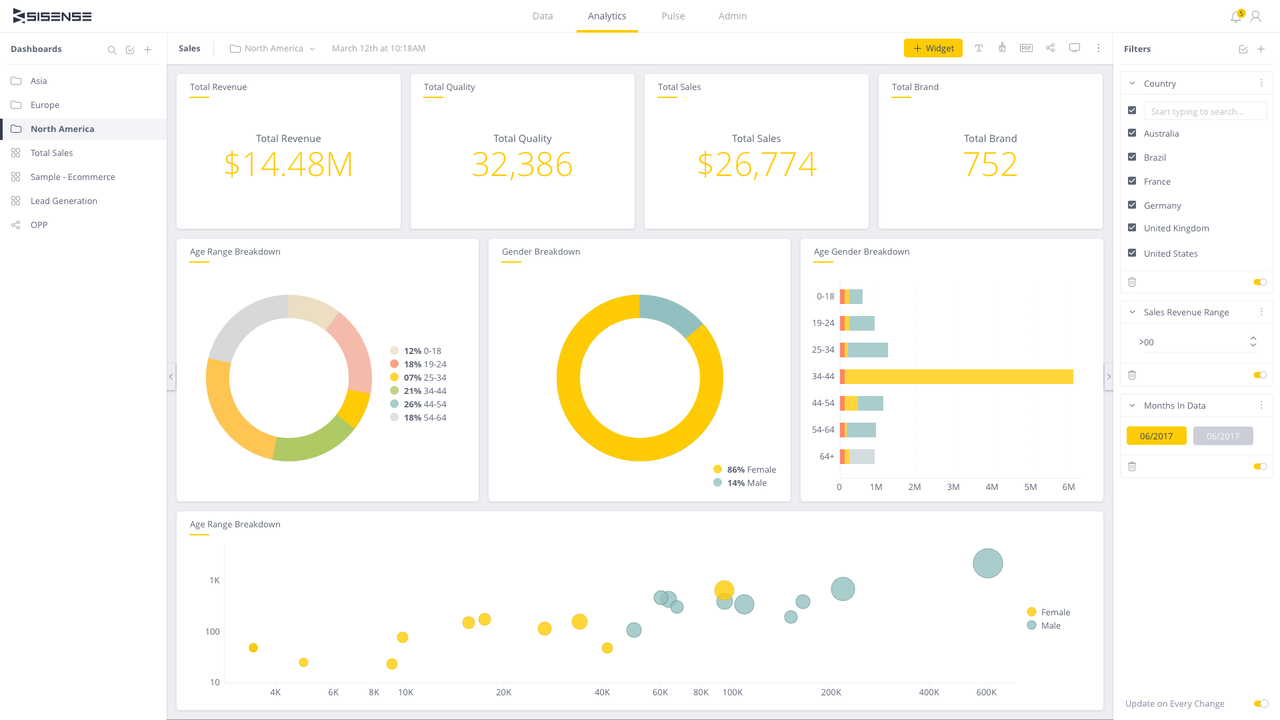
Sisense
Sisense simplifies business analytics for complex data. Powered by In-Chip and Single Stack technologies Sisense delivers unmatched performance, agility and value, eliminating much of the costly data preparation traditionally needed with business analytics tools and providing a single, complete tool to analyze and visualize large, disparate data sets without IT resources. Sisense’s expertise in complex data includes both large data sets and data derived from multiple, disparate sources. Sisense leverages In-Chip analytics to dramatically improve business users’ access to advanced analytics on low-cost, commodity machines without the need for special data warehouse tools or dedicated IT staff. One-click formulas offer…
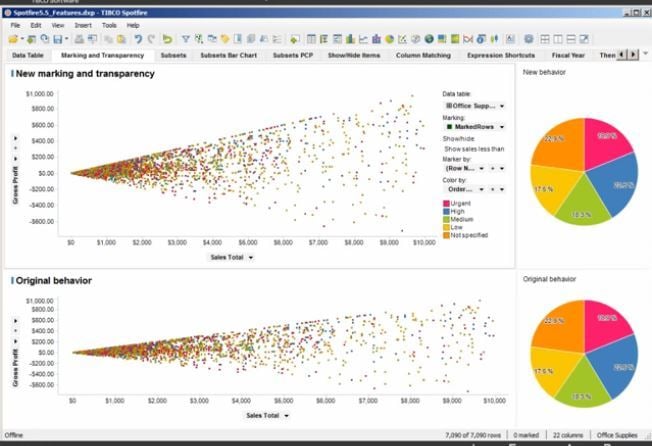
TIBCO Spotfire
TIBCO Spotfire : TIBCO Spotfire provides interactive dashboards, visualizations, and predictive and event-driven analytics, to develop unexpected insights immediately on any device. Spotfire is an enterprise class analytics platform that helps both business and technical users quickly explore data to develop actionable insights, without requiring IT intervention. Spotfire meets the analytic needs of users across the enterprise with data discovery and ad-hoc analysis, interactive reporting and dashboards, domain-specific applications, event-driven real-time analysis, and powerful predictive analytics. All these capabilities are delivered from a single product architecture. Spotfire Analyst makes comprehensive analytics fast and easy for a variety of users, allowing…
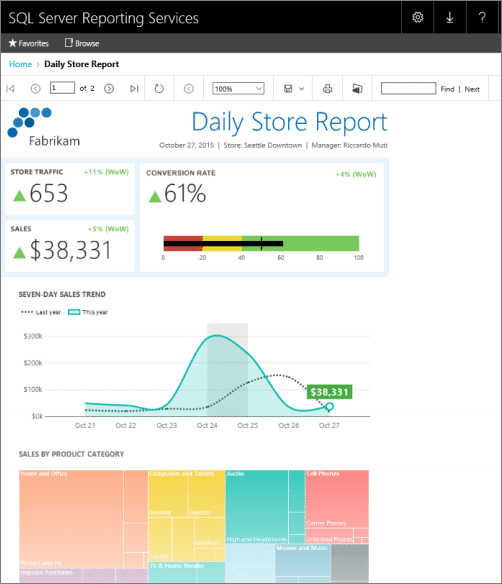
SQL Server Reporting Services
SQL Server Reporting Services provides tools and services that Create, deploy, and manage mobile and paginated reports for your organization. Reports can be mobile, paginated, interactive, tabular, and graphical, with a variety of data, including relational, multidimensional, and XML-based data sources. Reports can include rich data visualizations, including charts, maps, sparklines, and KPIs. Reporting Services is a server-based reporting platform. You publish reports to a report server, or as part of a Microsoft Windows application, or to a SharePoint site. You can schedule report processing, access reports on-demand, subscribe to published reports, and export reports to other applications such as…
Alteryx Analytics
Alteryx Analytics : Alteryx Analytics portfolio includes Alteryx Designer, Alteryx Server and Alteryx Analytics Gallery. Alteryx Designer allows to blend internal, third-party, and cloud-based data, build powerful R-based predictive and spatial analytics applications without any programming and share deep data insight with business decision makers. Predictive modeling techniques, such as logical regression or decision trees, clustering techniques such as K-centroid clustering and principle component analysis, data investigation techniques, such as scatter plots and association analysis- all can be included with out any programming using Alteryx Designer. Alteryx Server, scale the critical analytic workflows to meet data and analytic requirements, schedule…
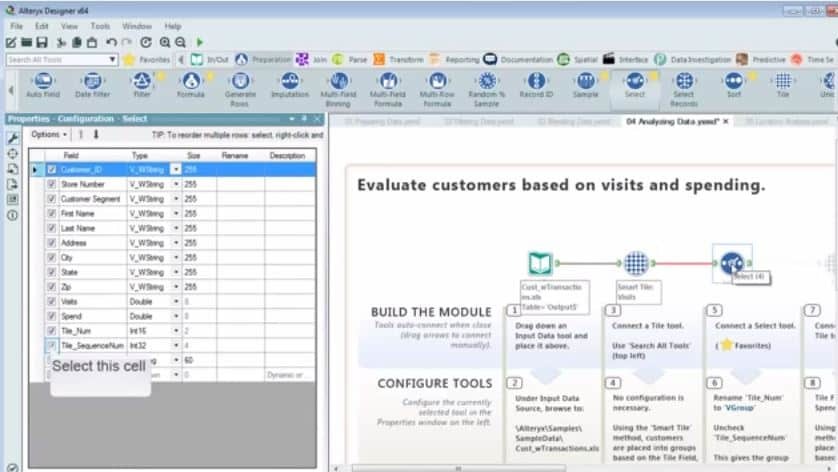
Tableau Desktop
Tableau Software helps people see and understand data. Tableau helps anyone quickly analyze, visualize and share information. Tableau Desktop is a product that everyone can use to ask new questions, spot trends, identify opportunities, and make data-guided decisions with confidence. Tableau’s Data Engine lets you extract data for ad-hoc analysis of massive data in seconds. It combines advances in database and computer graphics technology so you can analyze huge datasets on a laptop. Tableau is 10-100x faster than existing solutions. It's designed to support how people think.Tableau Desktop is a product that everyone can use to ask new questions, spot…
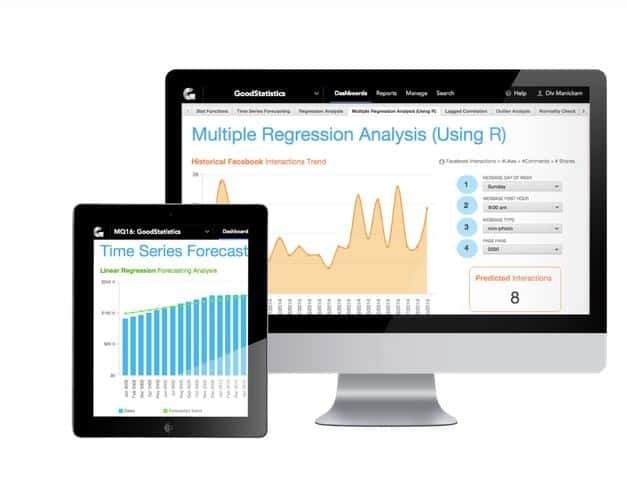
GoodData
The GoodData platform includes advanced distribution and product lifecycle management features to automate the process of maintaining one-to-many cloud deployments. GoodData provides a highly engaging guided analytic exploration experience that drives actionable insights by teaching users best practice techniques through recommendations inside the interface.GoodData’s dashboards are responsive, mobile optimized, and include built-in alert, email and collaboration features to promote sharing across the organization GoodData provides groundbreaking BI for data monetization to enterprises, independent software vendors, and system integrators who seek to unlock the value of data for their business networks with engaging, one-to-many analytics. The intelligent analytics distribution platform enables…
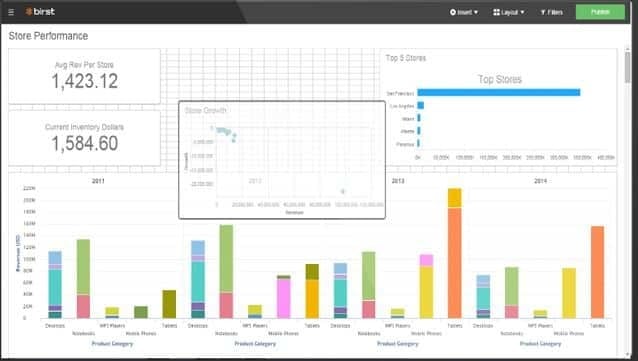
Birst BI
Networked BI creates a set of interwoven BI instances that share a common analytical fabric. This enables organizations to expand the use of BI across multiple regions, departments and customers in a more agile way, and empowers these decentralized teams to augment their enterprise data with their own local data. Networked BI is different, allowing both top-down and bottom-up blending of data. The result is local execution with global governance, eliminating data silos once and for all and dramatically accelerating the delivery of BI across the enterprise. Birst’s Networked BI platform redefines the way BI is delivered and consumed, eliminating…
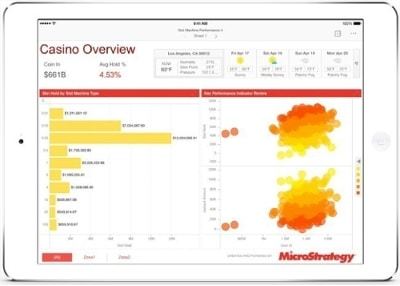
MicroStrategy
MicroStrategy makes sophisticated functionality accessible to every user, from administrators to business analysts. MicroStrategy makes it easy to seamlessly connect to any enterprise resource, including databases, mobile device management (MDM) systems, enterprise directories, cloud applications, physical access control systems, and more. MicroStrategy delivers a broad set of business intelligence services that can be deployed on-premises with MicroStrategy Server or via the MicroStrategy Secure Cloud. This service-oriented architecture dynamically assembles metadata objects and provides the core analytical processing power for any business intelligence project. MicroStrategy analytics platform meets the needs of business and IT. It empowers organizations to make sense of…
ClearStory Data
ClearStory Data : ClearStory Data infers what’s in data to speed data preparation and converge disparate data on the fly. Internal and external data access requires no pre modeling or skills that mandate data specialists. ClearStory’s Intelligent Data Harmonization identifies data relationships across disparate data sources and converges data on-the-fly, to reach holistic, interactive answers faster. ClearStory’s advanced data harmonization platform is powered by an inference and profiling engine to extract metadata in real-time, using Apache Spark’s fast in-memory processing. Data dimensions including dates, time, currencies, geographical entities, and other custom attributes can be inferred and blended with no pre-modeling or…
![]()
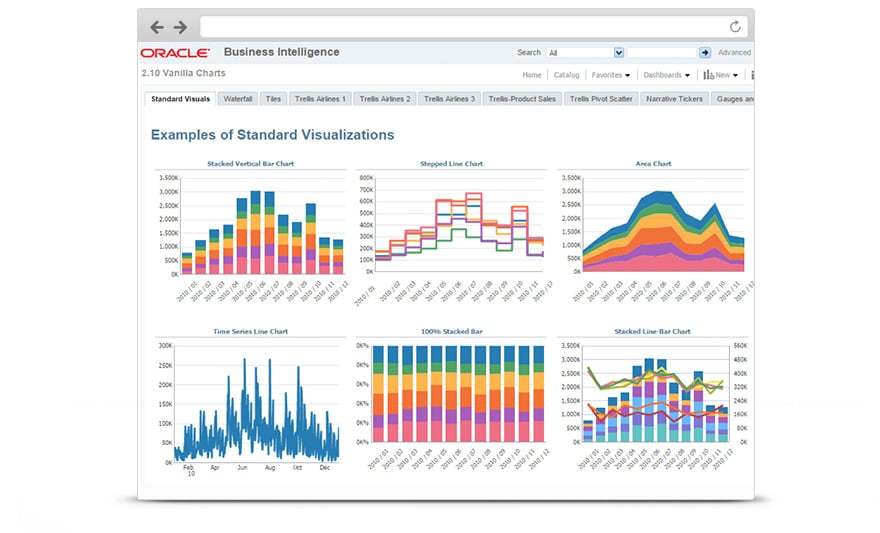
Oracle Business Intelligence
Oracle Business Intelligence simplify your analytics strategy by standardizing on one integrated platform, centralize your data models and metrics for a comprehensive representation of the business and enable business leaders to securely access and explore data no matter where they are via mobile devices and the cloud. Data Visualization in Oracle Business Intelligence offers a rich consumer style experience that is now common across Oracle’s analytics portfolio. Additionally, the entire user experience has been streamlined, demonstrating Oracle’s continued commitment to making analytics as fast, flexible, and friendly as they are powerful and robust. Oracle offers new self service capabilities for…
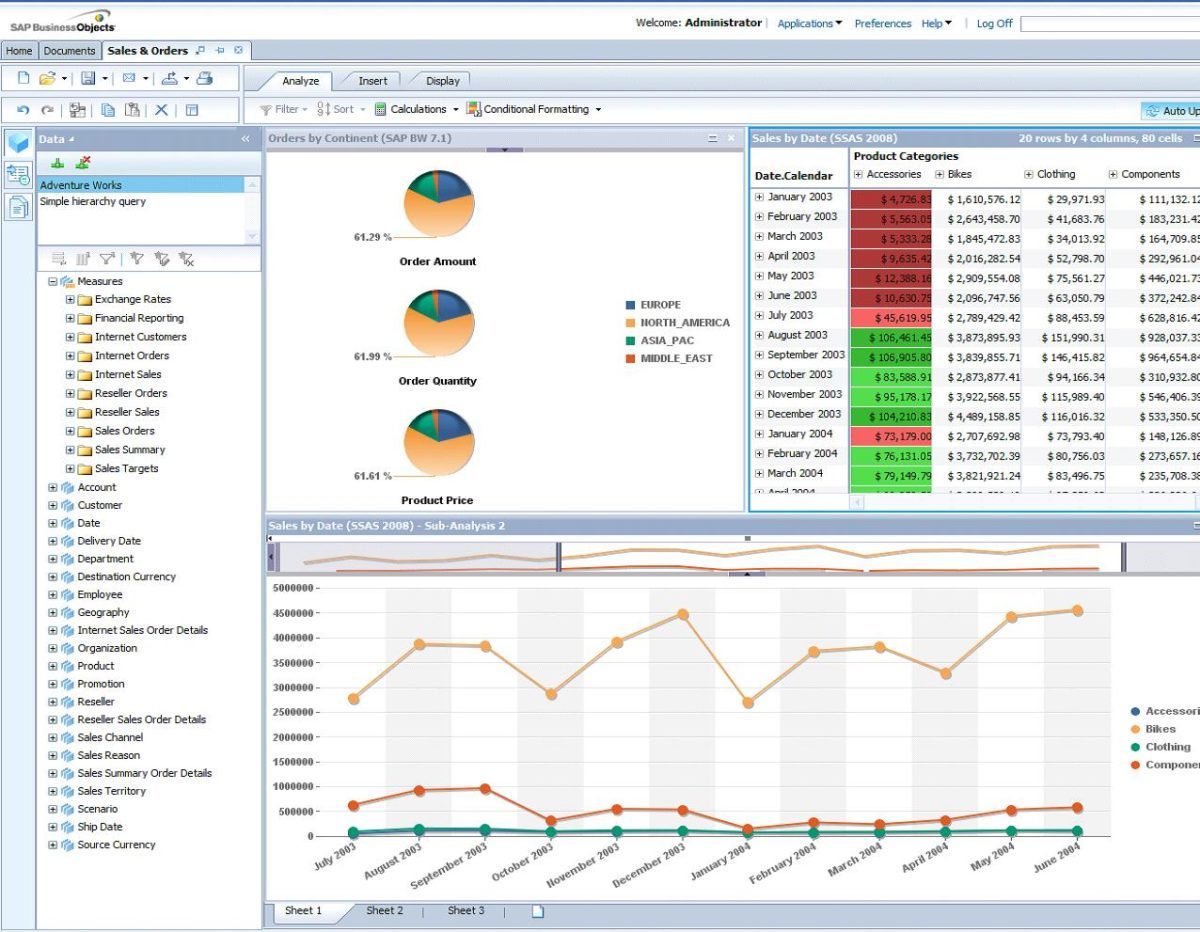
SAP BusinessObjects BI
SAP BusinessObjects BI solutions are designed to empower organization to achieve remarkable results by enabling trusted data discovery. The solutions help you to transform decisions by providing fact-based information, regardless of where data resides. Using SAP BusinessObjects BI solutions, organization gains increased visibility of key performance indicators (KPIs) across lines of business, improves relationships with customers and suppliers, saves time and money, and can respond faster when exceptions occur. SAP BusinessObjects BI provides Ad-hoc reporting and analysis and Multidimensional analysis. Answer new and evolving business questions with self-service ad-hoc reporting and analysis – on the Web, your desktop, or a…
Salesforce Wave Analytics
Salesforce Wave Analytics is the only analytics solution that is designed especially for Salesforce users. Get immediate results that the business needs with its native integration feature that runs quickly with speed, scale, and security of Salesforce. This also means that users are not dependent on any professional people to help them support with managing the information. With too many data going in and out, Salesforce Wave Analytics makes it easy for users to connect to their Sales Cloud and Service Cloud data that can be used to explore any data that can be used to identify latest trends and…
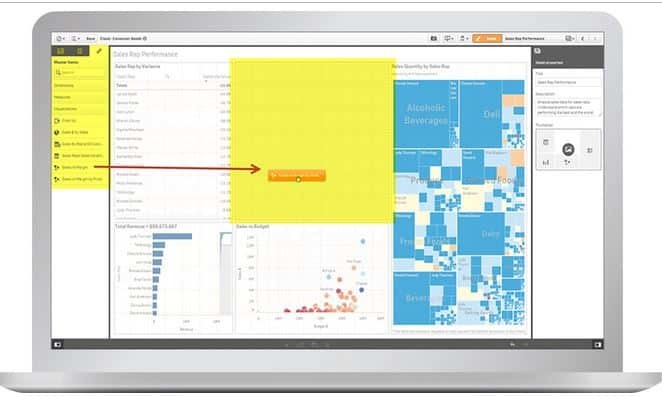
Qlik Sense Enterprise
Qlik Sense self-service visualization drive insight discovery with the data visualization app that anyone can use. With Qlik Sense, everyone in your organization can easily create flexible, interactive visualizations and make meaningful decisions. Qlik Sense Desktop Import your own data and experience the power of Qlik Sense. Use simple drag-and-drop interfaces to create flexible, interactive data visualizations. Explore data with smart visualizations that automatically adapts to the parameters you set — no need for developers, data scientists or designers. Qlik Sense offers improved capabilities for business users to load, transform, and enrich their data without the need for complex scripting. Qlik…
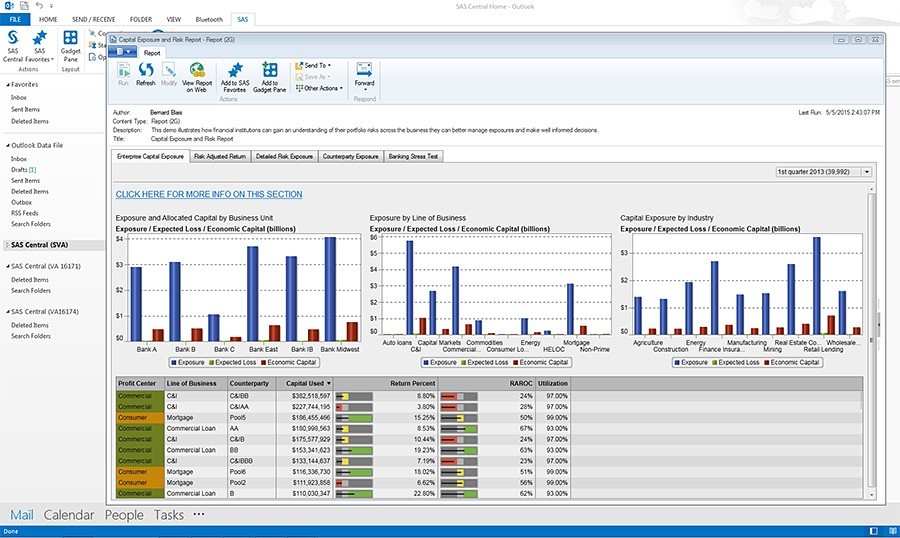
SAS Office Analytics
SAS Office Analytics provide powerful BI capabilities in everyone's reach to spark collaboration and inspire better-informed decisions. Integrate and tell stories with your data. Create analytic content. All with minimal IT support. SAS Office Analytics create and distribute rich, interactive content delivered through an established framework. Publish charts, graphs and other visuals created in SAS Visual Analytics to Microsoft Office users. Business analysts and novice users can get on board quickly thanks to guided analysis via built-in tasks and visual process flows in SAS Enterprise Guide. Users can quickly access, prepare and integrate data to meet evolving business requirements. And…
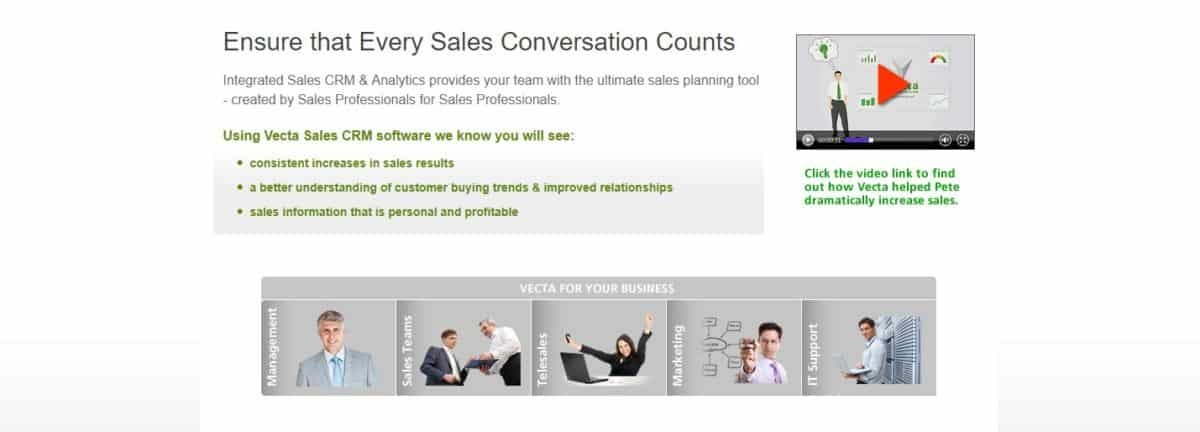
Vecta
Vecta is a sales management and a sales acceleration solutions which provides a visual overview of your sales operations and customer information. It delivers exceptional levels and quality of sales information whenever and wherever needed, helping sales teams to achieve and maintain increased sales results and maximizing the potential of every selling opportunity. Vecta is best suited for manufacturing, wholesale and distribution sectors, operating in competitive and price sensitive markets. Vecta analyzes historical transactional data, and identifies gaps in spending patterns, to instantly alerts sales teams to increase sales opportunities and enhance margins. It’s customer focused and provides information about…
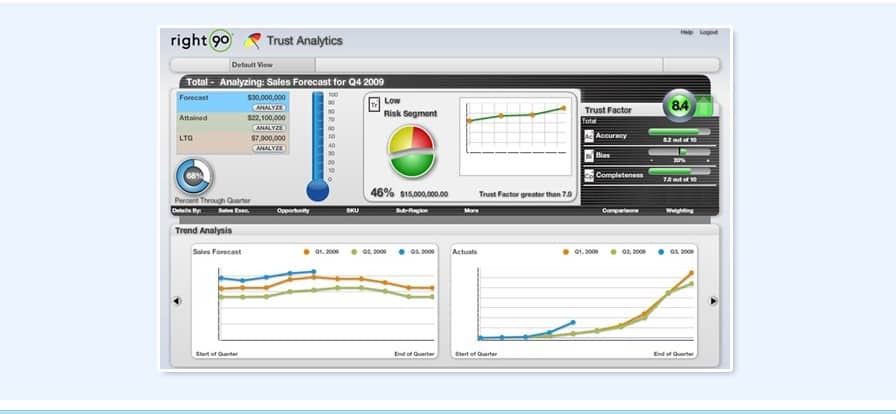
Right90
Right90 Trust Analytics enables sales managers to understand how good their forecast is and what is driving the quality of their forecast. Right90 Trust Analytics scores the forecast and shows managers how likely accurate the forecast is by sales rep, customer, product, region, etc. A sales manager, for example, can use this data when judging the forecast submitted by his reps — turning forecasting into a more objective process. Managers can also use this data to identify what’s driving good and bad forecasts so that they can improve their forecasts over time. Right90 Trust Analytics utilizes past historical performance to…
IBM Sales Performance Management
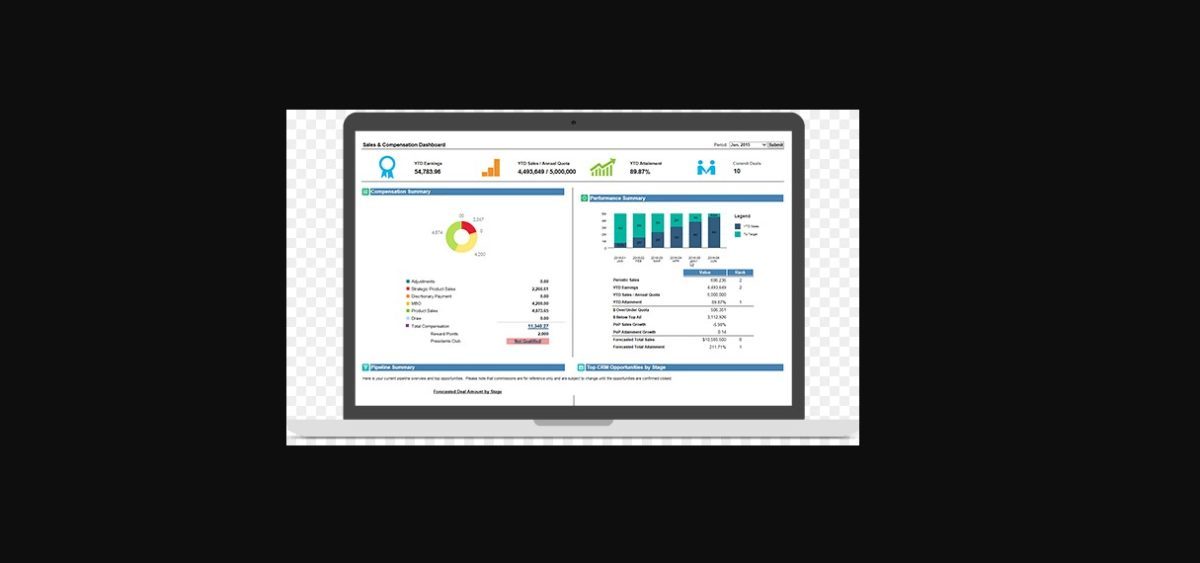
IBM Sales Performance Management (SPM) software is a tool that automates the processes of administering, calculating, reporting and analyzing variable-based compensation plans. It streamlines plan administration, reduces payment errors and gives deep sales insights without requiring deep technical skills to run it. IBM SPM helps better align resources, drive operational efficiency and improve agility to support growth objectives. With automated calculations and online compensation statement, Incentive Compensation Management tool improves the efficiency and effectiveness of sales team, by managing territories and assignments and by planning and distributing sales quotas. It motivates the sales team by aligning territories and incentive compensation,…
IBM Sales Performance Management
You may like to read: What is Reporting Software?, Top Best Practices in Reporting Software and Free, Open Source and Top Reporting Software.
What are Sales Analytics Software?
Sales Analytics and Sales Intelligence Reporting deals with comprehensive analytic solution that provides real time, fact-based insight into the entire sales process. Sales Analytics or Sales intelligence refers to technologies, applications and practices for the collection, integration, analysis, and presentation of information to help salespeople keep up to date with clients, prospect data and drive business.
What are the Top Sales Analytics and Sales Intelligence Reporting Software?
Top Sales Analytics and Sales Intelligence Reporting Software include Sisense, TIBCO Spotfire, SQL Server Reporting Services, Alteryx Analytics, Tableau Desktop, GoodData, Birst BI, MicroStrategy, ClearStory Data, Oracle Business Intelligence, SAP BusinessObjects BI, Salesforce Wave Analytics, Qlik Sense Enterprise, SAS Office Analytics, Vecta, Right90, IBM Sales Performance Management are some of the Top Sales Analytics and Sales Intelligence Reporting Software.


ADDITIONAL INFORMATION
Hello CRM Report,
I have no quibbles with the list of analytics apps in your report but there are two key point that needs to be made about all the products that made your list; 1) They are very expensive and 2) require SIGNIFICANT investment in people resources in order to grasp and master the nuances of that tool plus, none I assert that these products are not suitable for SMB class firms because of cost and resources required.
In our practice, which focuses on firms averaging 50 people or less we have adopted Apsona as our tool. The Apsona Multi-Step & Direct Merge products have allowed us to create high detailed, data rich, SFDC reports within the SFDC framework that are impossible for the native report tool and the majority of the tools listed to produce and I can demonstrate several examples if you wish to see what I’m talking about.
Since reporting represents an important part of our practice its an area where I have a lot of passion and have also had to learn how to make analytics “actionable” not just visual. I think its also important to include apps that are robust and powerful and affordable.
ADDITIONAL INFORMATION
Hi CRM Report
I completely agree with Jeff all the tools mentioned above are general purpose reporting tools and NOT sales. It takes a lot of work and time to enable them.
Full disclosure I work for a Sales Intelligence / Analytics vendor called MoData (http://www.mo-data.com). We offer “BI platform for sales” so I am intimately familiar with the landscape. Let me compare and contrast what general purpose tool can do compared to specific intelligence platforms built for sales
1. On-Boarding: Sales Intelligence platforms like MoData have 100s of metrics pre-built sales charts / reports available out-of-the-box. On-boarding a new customer is easy and swift. Most such tools allow fair amount of easy customization so the reports actually take into account nuances of your sales processes.
1.1. While general purpose tools definitely offer more visualizations but the ease / speed of deployment trumps lack of a particular type of visualization. Sales managers typically prefer simple visualizations anyway
2. History Tracking / Business Intelligence: Most sales analytics platform (certainly MoData) capture history of changes to your CRM (including SFDC, Hubspot, Dynamics), Sales Enablement systems like outreach.io, persistIQ and lead nurturing systems like Marketo, Pardot Eloqua etc. This is critical to infuse “intelligence” in sales decision making. Knowing your KPI numbers at any point in time, is typically not enough. A sales leader needs to know how they got there? The trends behind the metrics.
Sales Intelligence Tools, track Changes to your CRM / other sales enablement systems and provide trending information. If you pipeline changes week-over-week you want to know what specifically change right? That’s what these tools provide.
3. Sales Forecasting: This is where sales intelligence tools like MoData and others really shine. It’s one of the most important activity that sales management partakes in and this feature simply does not exist in general purpose reporting tools. Sales forecasting allows to easily collect bottoms up guidance about the likelihood of deal closure and amount. It’s especially useful for first and second line managers to provide their feedback. Let’s face it a lot of reps are not updating CRM as regularly as we all would like
There are just too many things many details, including things like Alerts, Account Based Sales Analytics, Target account engagement tracking, Content Usage Tracking so on and so forth.
Bottom line:
Basic visualization tools require too much upfront work and miss quite a few critical functions to be useful for specific sales scenarios. They are generally too expensive for most organizations especially if you include hefty on-boarding/upfront consulting fee. If sales analytics is the goal, you would be well advised to look beyond general-purpose analytics to specific sales intelligence / analytics tools.
ADDITIONAL INFORMATION
For some organizations, sales are vital to driving income and developing the business. The correct apparatuses are major to helping present day deals groups grow better business connections and improve their business forms. Stumbled upon this which can help your audience well and yeah Sales analytics is a useful way to better understand what parts of the sales strategy and sales methods are working,