Sign in to see all reviews and comparisons. It's Free!
By clicking Sign In with Social Media, you agree to let PAT RESEARCH store, use and/or disclose your Social Media profile and email address in accordance with the PAT RESEARCH Privacy Policy and agree to the Terms of Use.
R is a free software environment for statistical computing and graphics. It compiles and runs on a wide variety of UNIX platforms, Windows and MacOS. R is an integrated suite of software facilities for data manipulation, calculation and graphical display.
Category
Predictive Analytics Software
Features
• Open Source - Free Software • Provides a wide variety of Statistical (linear and nonlinear modeling, classical statistical tests, time-series analysis, classification, clustering) and Graphical Techniques • Effective data handling and storage facility • Suite of operators for calculations on arrays, in particular matrices • Large, coherent, integrated collection of intermediate tools for data analysis • Graphical facilities for data analysis and display either on-screen or on hardcopy • Well-developed, simple and effective programming language which includes conditionals, loops, user-defined recursive functions and input and output facilities
License
Open Source Software
Price
Free
Pricing
Subscription
Free Trial
Available
Users Size
Small (<50 employees), Medium (50 to 1000 Enterprise (>1001 employees)
• Open Source - Free Software • Provides a wide variety of Statistical (linear and nonlinear modeling, classical statistical tests, time-series analysis, classification, clustering) and Graphical Techniques • Effective data handling and storage facility • Suite of operators for calculations on arrays, in particular matrices • Large, coherent, integrated collection of intermediate tools for data analysis • Graphical facilities for data analysis and display either on-screen or on hardcopy • Well-developed, simple and effective programming language which includes conditionals, loops, user-defined recursive functions and input and output facilities
What are the benefits?
• Brings analytics to your data • Runs on a wide variety of platforms- UNIX, Windows, MacOS • Widely used statistical software • Easy to learn • Natural and expressive • Renowned capabilities to visualize data.
PAT Rating™
Editor Rating
Aggregated User Rating
Rate Here
Ease of use
9.0
6.9
Features & Functionality
9.1
7.6
Advanced Features
9.2
8.5
Integration
9.0
6.5
Performance
9.1
7.1
Customer Support
9.2
5.1
Implementation
7.0
Renew & Recommend
6.8
Bottom Line
R is a free software environment for statistical computing and graphics. It compiles and runs on a wide variety of UNIX platforms, Windows and MacOS. R is an integrated suite of software facilities for data manipulation, calculation and graphical display.
9.1
Editor Rating
7.1
Aggregated User Rating
26 ratings
You have rated this
R is a free software environment for statistical computing and graphics. It compiles and runs on a wide variety of UNIX platforms, Windows and MacOS. R is an integrated suite of software facilities for data manipulation, calculation and graphical display.
Some of the functionalities include an effective data handling and storage facility, a suite of operators for calculations on arrays, in particular matrices, a large, coherent, integrated collection of intermediate tools for data analysis, graphical facilities for data analysis and display either directly at the computer or on hardcopy, and well developed, simple and effective programming language which includes conditionals, loops, user defined recursive functions and input and output facilities.
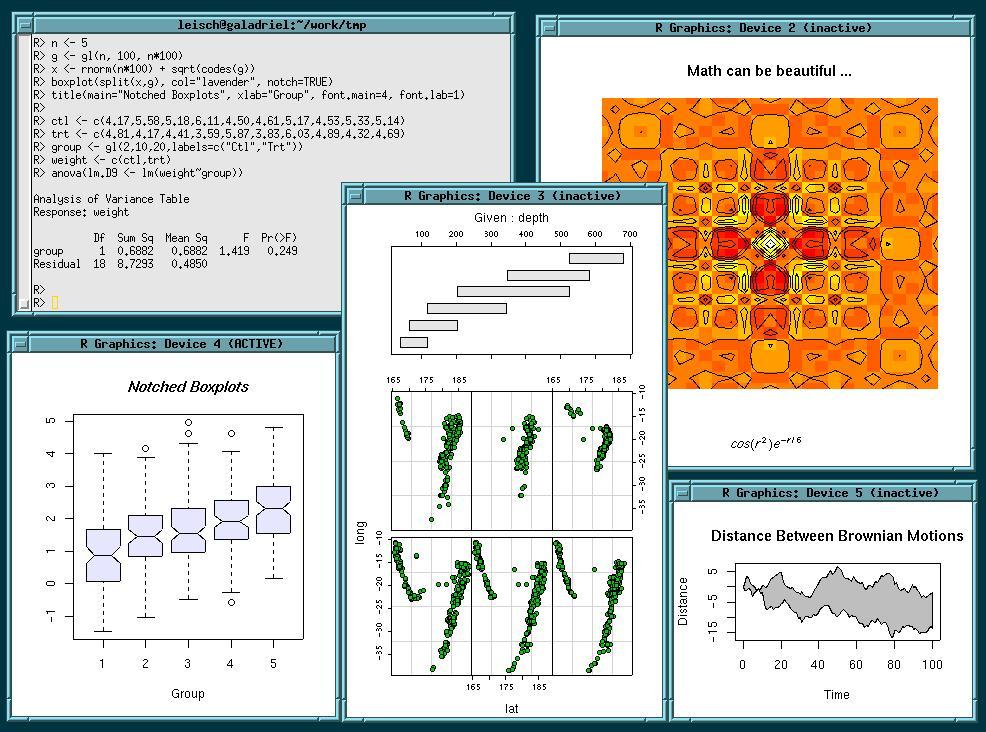
R Unix desktop
R is very much a vehicle for newly developing methods of interactive data analysis. It has developed rapidly, and has been extended by a large collection of packages. The R language is widely used among statisticians and data miners for developing statistical software and data analysis.
R Software Environment
R provides a wide variety of statistical and graphical techniques, including linear and nonlinear modeling, classical statistical tests, time-series analysis, classification, clustering, and others. R is easily extensible through functions and extensions, and the R community is noted for its active contributions in terms of packages. There are some important differences, but much code written for S runs unaltered. Many of R's standard functions are written in R itself, which makes it easy for users to follow the algorithmic choices made.
The capabilities of R are extended through user-created packages, which allow specialized statistical techniques, graphical devices such as ggplot2, import/export capabilities, reporting tools such as knitr, Sweave.
MacOS X RAqua desktop
R Graphical user interfaces
• Deducer is a GUI for menu driven data analysis which is similar to SPSS/JMP/Minitab. • Java GUI for R is a cross-platform stand-alone R terminal and editor based on Java . • Rattle GUI is a cross-platform GUI based on RGtk2 and specifically designed for data mining. • R Commander is a cross-platform menu-driven GUI based on tcltk. • Revolution Analytics provides a Visual Studio based IDE. • RGUI comes with the pre-compiled version of R for Microsoft Windows. • RKWard is an extensible GUI and IDE for R. • RStudio is a cross-platform open source IDE. • RWeka allows for the use of the data mining capabilities in Weka and statistical analysis in R.
R pairs plot
Editors and IDEs
Text editors and Integrated development environments (IDEs) with some support for R include: ConTEXT, Eclipse (StatET), Emacs (Emacs Speaks Statistics), LyX (modules for knitr and Sweave), Vim, jEdit, Kate,Revolution R Enterprise DevelopR (part of Revolution R Enterprise), RStudio, Sublime Text, TextMate, WinEdt (R Package RWinEdt), Tinn-R and Notepad++.
R
Scripting languages
R functionality has been made accessible from several scripting languages such as Python,Perl,Ruby,and F#.PL/R can be used alongside, or instead of, the PL/pgSQL scripting language in the PostgreSQL and Greenplum database management system. Scripting in R itself is possible via littler.
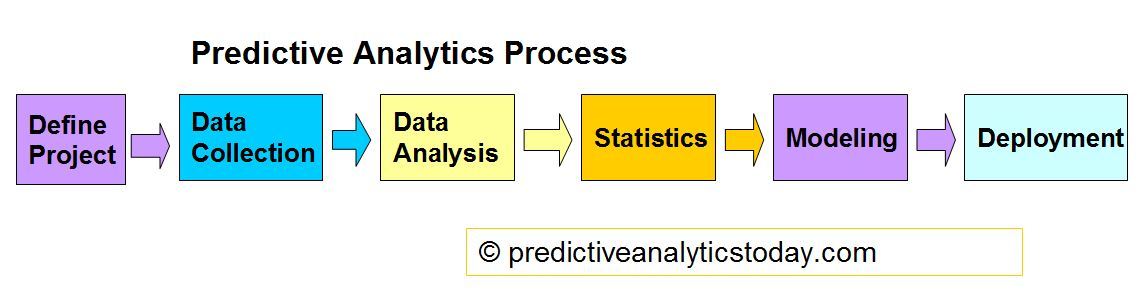
Optimization of portfolios and prediction analytics
What is best?
The system that R runs on does not allow for clicking and dragging, and this might sound challenging. But R operates on a language of coding functions and scripts which you have to Run in order for it to work.
What are the benefits?
R is a very powerful statistical computing, graphics and machine learning programming language that allows optimization of portfolios, analysis of genomic sequences and prediction analytics among other functions. R compiles and runs on a wide variety of platforms such as UNIX/Linux, Windows and Mac OS X.
Company size
Enterprise (>1001)
User Role
Consultant
User Industry
Financial services
Rating
Ease of use8.5
Features & Functionality8.6
Advanced Features8.2
Integration8.5
Performance8.8
Training 8.6
Customer Support8.6
Implementation8.4
Renew & Recommend8.4
ADDITIONAL INFORMATION The language is fairly easy to learn, very natural and quite expressive for data analysis purposes. R comes with a set of packages when installing, but it also includes an extension where you can choose to add more. R as a language has been enhanced by Microsoft Corp. to Microsoft R and this has allowed it to encompass a lot of merit features. Being the enhanced version of R, Microsoft R is a definite platform for statistical analysis and is fully compatible with R packages , applications and scripts that work with that version of R. The Microsoft R product family includes Microsoft R Server, Microsoft R Client, Microsoft R Open and SQL Server R Services.


ADDITIONAL INFORMATION
really gud to work
Optimization of portfolios and prediction analytics
The system that R runs on does not allow for clicking and dragging, and this might sound challenging. But R operates on a language of coding functions and scripts which you have to Run in order for it to work.
R is a very powerful statistical computing, graphics and machine learning programming language that allows optimization of portfolios, analysis of genomic sequences and prediction analytics among other functions. R compiles and runs on a wide variety of platforms such as UNIX/Linux, Windows and Mac OS X.
Enterprise (>1001)
Consultant
Financial services
ADDITIONAL INFORMATION
The language is fairly easy to learn, very natural and quite expressive for data analysis purposes. R comes with a set of packages when installing, but it also includes an extension where you can choose to add more. R as a language has been enhanced by Microsoft Corp. to Microsoft R and this has allowed it to encompass a lot of merit features. Being the enhanced version of R, Microsoft R is a definite platform for statistical analysis and is fully compatible with R packages , applications and scripts that work with that version of R. The Microsoft R product family includes Microsoft R Server, Microsoft R Client, Microsoft R Open and SQL Server R Services.