
20 Free, Cloud and Open Source Business Intelligence Software

Business Intelligence (BI) refers to the processes, technologies, and tools used to gather, store, analyze, and provide access to data to support decision-making and drive business performance. The goal of BI is to turn data into actionable insights, enabling organizations to make informed decisions and improve their operations. BI includes data warehousing, data mining, reporting, online analytical processing, and predictive analytics.
Business Intelligence Software enables, the collection and ingestion of intelligence data through enrichment and augmentation.Business Intelligence technologies provide historical, current and predictive views of business operations.
Business Intelligence Software
The common functions of business intelligence technologies are reporting, online analytical processing, data mining, process mining, business performance management, benchmarking and analytics. Business Intelligence (BI) is a popular topic today because many companies have recognized the importance of using technologies that allow them to analyze data and present actionable information.
With this type of technology, business owners, managers, and frontline employees in different departments can quickly make informed decisions. Most businesses collect and analyze data in different forms and one of the best ways of analyzing data is to use the appropriate software. Their data would be irrelevant without using the right tools to capitalize on it in order to add value to their business activities.
The best BI software allows organizations to collect data, gain insights from the data, automate processes, analyze data, visualize information, and deliver useful information to users in the form of reports. All businesses should consider utilizing BI software because it includes features that allow them to make informed decisions and consequently stay ahead of the competition.
What are Business Intelligence Software?
Business Intelligence (BI) software is a type of application that enables organizations to gather, store, access, and analyze data to make informed decisions and improve their business operations. BI software typically includes features such as data warehousing, data mining, reporting, online analytical processing, and predictive analytics, and provides an easy-to-use interface for non-technical users to access data insights. BI software solutions can be delivered on-premises or as a cloud-based service, and are used across various industries to support decision-making, performance management, and business strategy development.
Business Intelligence Software allows users to collect, sort, organize, analyze and present data into easy-to-understand information for insights. Companies use the software to gain insights from their data and create reportable data sets. The software can collate data from various sources such as relational databases, XML data sources, and other data streams.
Business Intelligence Software includes the tools needed to leverage cloud computing and big data for reporting, online analytical processing, data mining, process mining, business performance management, benchmarking and analytics. It also simplifies data analysis processes and helps organizations adopt standardised BI practices across departments.
Today’s BI applications are easy to install and can easily integrate with existing systems. They can also be used by lay users. Business Intelligence solutions are available in the form of standalone applications or clodu based. Your choice will depend on the requirements of your business.
Small, medium and large-sized businesses can benefit from BI solutions because every business must make decisions based on its data.
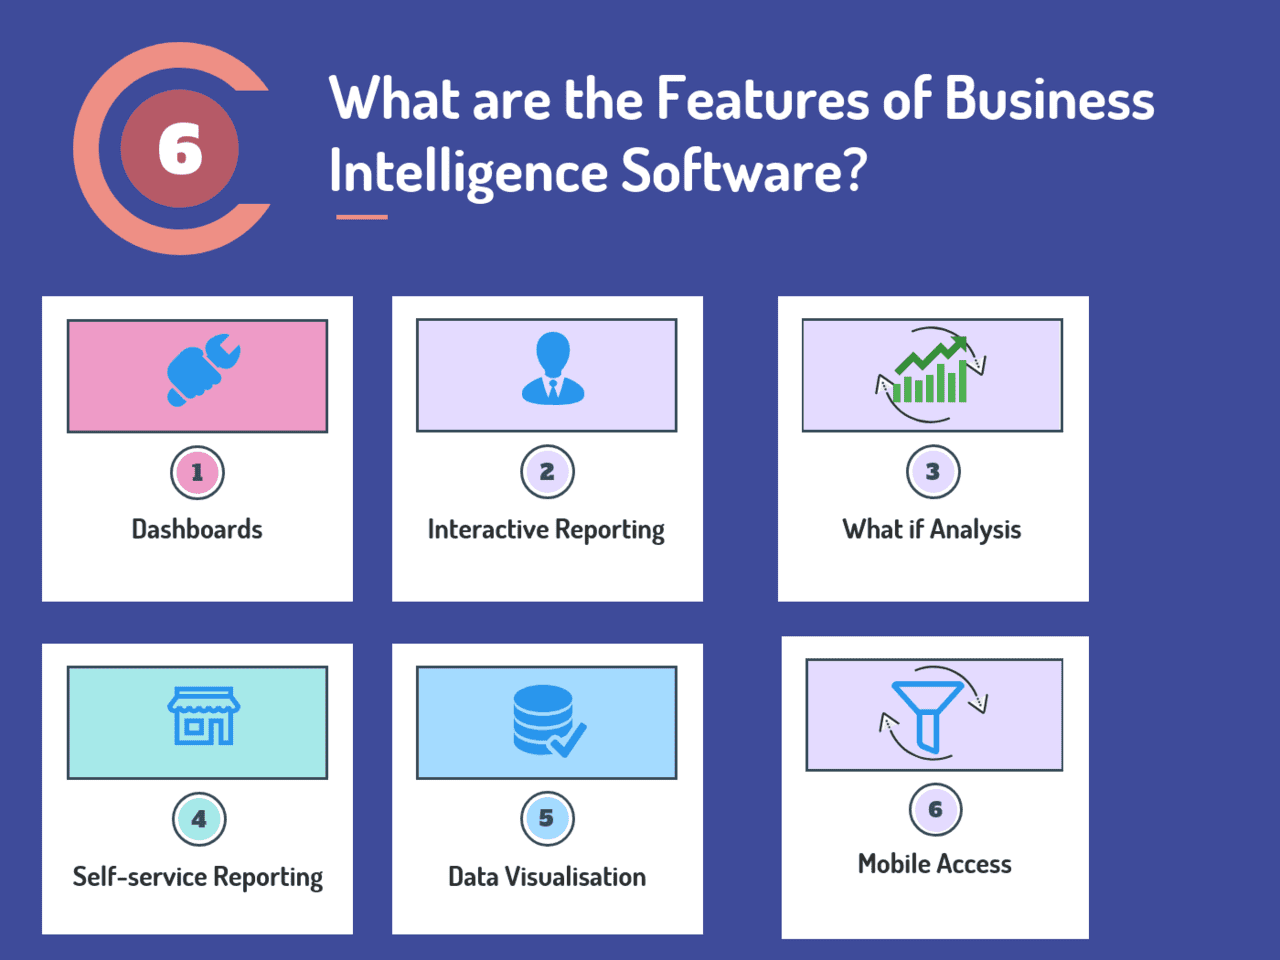
What are the features of Business Intelligence Software?
Business Intelligence (BI) software typically includes several key features, including data warehousing, data mining, reporting, online analytical processing, and predictive analytics. Data warehousing allows organizations to gather, store, and manage large amounts of data from various sources in a centralized repository. Data mining enables organizations to uncover hidden patterns, relationships, and insights in their data. Reporting provides visual representations of data in the form of dashboards, charts, and reports. Online analytical processing (OLAP) allows users to analyze data in real-time, and predictive analytics uses machine learning algorithms to forecast future trends and outcomes. Other common features of BI software include data visualization, collaboration tools, and mobile accessibility. These features work together to provide a comprehensive solution for decision-making and performance improvement.
- Dashboards : Include tools that allow users to create interactive dashboards. Users can even publish and share dashboards with other users. Dashboards allow users to monitor and analyze data across different services and display real-time data.
- Interactive Reporting: Allows users to create interative reporting, to summarize, compare, and share data in the form of reports. Users can create interactive reports on different platforms such as computers and mobile devices.
- What if Analysis: Helps businesses predict how they might be affected by certain situations. Includes tools to do what if scenario basis analysis to determine the possible outcome based on the input.
- Self-service Reporting: Empowers BI software users to generate reports and make innovative decisions based on their own reports. It is both IT and end-user friendly so anyone can use it without asking for IT help. Self-service reporting also enables users to quickly get answers to complex queries.
- Data Visualisation: Effective reporting with BI software is possible because of data visualization. This feature enables all types of users to display data in dashboard widgets, charts, and graphs. Businesses can use it to visualize their key data or information.
- Mobile Access: Many people including business executives and ordinary employees need a flexible responsive platform. Many BI applications are mobile optimized meaning users can access them on mobile devices.
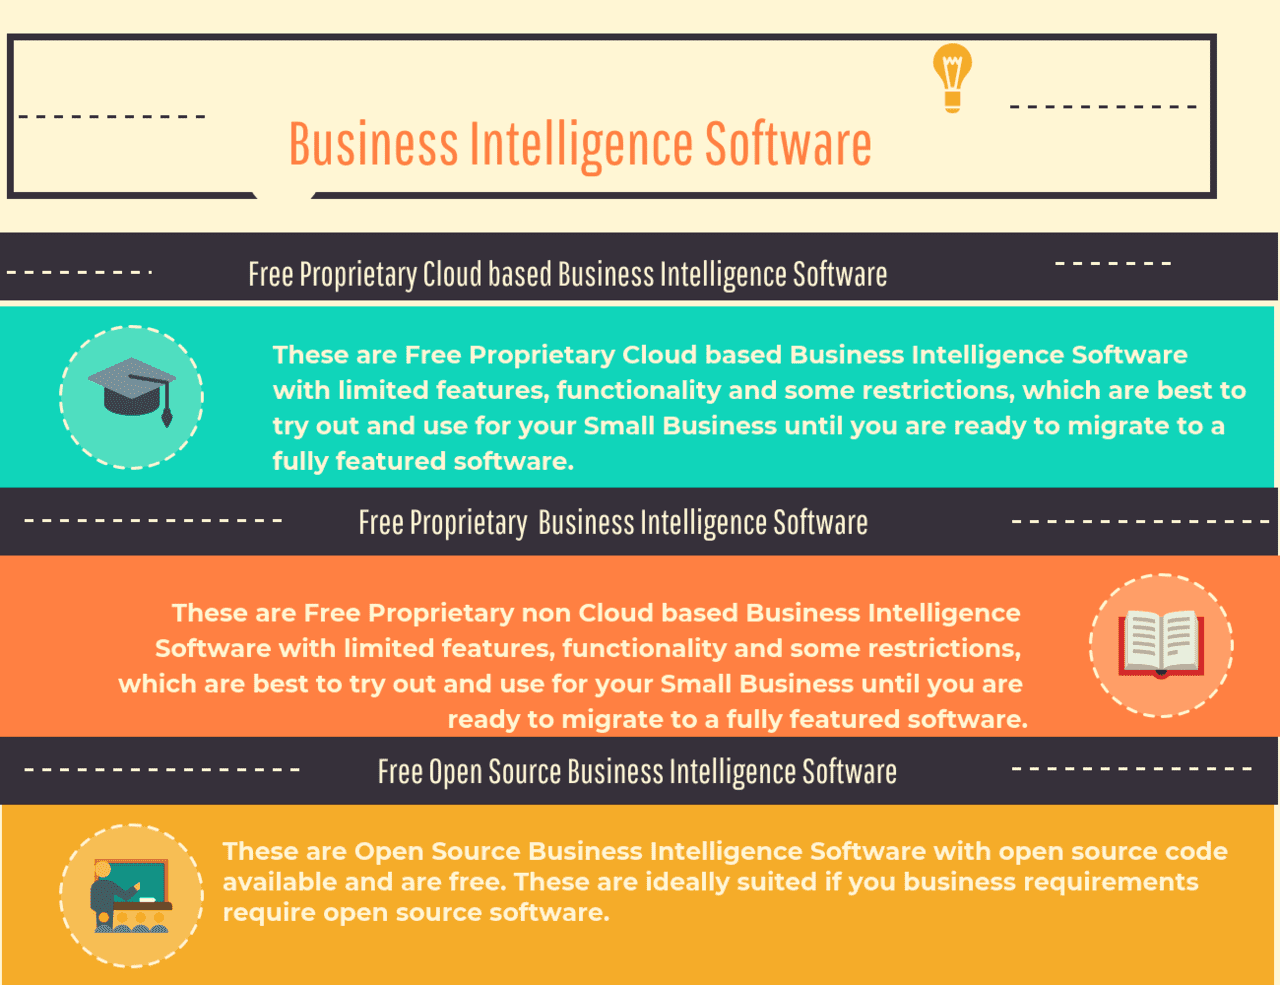
The Best of the FREE Business Intelligence Software Types
What are the Best Free Cloud Business Intelligence Software: Sisense, Sisense for Cloud Data Teams, Google Data Studio, Cluvio, Tableau Public, Visualize Free, Databox Free Edition are some of the Top Free Cloud Business Intelligence Software.
What are the Best Free Open Source Business Intelligence Software: Seal Report, Apache Superset, BIRT, Metabase, A Reporting Tool, ReportServer Community Edition, SQL Power Wabit, Widestage are some of the Top Open Source Business Intelligence Software.
What are the Best Free Proprietary Business Intelligence Software: Cluvio, QlikView Personal Edition, Kyubit Business Intelligence, EspressReport Lite, Arcadia Data Instant are some of the Top Free Proprietary Business Intelligence Software.
Free Cloud Business Intelligence Software:


Sisense
Sisense simplifies business analytics for complex data. Powered by In-Chip and Single Stack technologies Sisense delivers unmatched performance, agility and value, eliminating much of the costly data preparation traditionally needed with business analytics tools and providing a single, complete tool to analyze and visualize large, disparate data sets without IT resources. Sisense’s expertise in complex data includes both large data sets and data derived from multiple, disparate sources. Sisense leverages In-Chip analytics to dramatically improve business users’ access to advanced analytics on low-cost, commodity machines without the need for special data warehouse tools or dedicated IT staff. One-click formulas offer…
Sisense free trial edition gives you a complete end-to-end BI solution and lets you experience data preparation, analytics and visualization with Sisense.
•Join data from multiple sources
•Drag & drop joining of multiple data sources
•Build interactive dashboards with no tech skills
•Share interactive dashboards
•Provide users the freedom to query data in real-time
Contact for Pricing
• Single-Stack™ architecture
• Sisense innovative In-Chip™ engine
• Groundbreaking. Powerful. Simple.
• IoT, machine learning, and AI in cutting edge BI platform
• Easily and quickly get the answers they need from complex data
• Easy to connect your data, get up and running instantly and deliver fast results
Sisense for Cloud Data Teams
Sisense for Cloud Data Teams formerly Periscope Data is an end-to-end BI and analytics solution that lets you quickly connect your data, then analyze, visualize and share insights. Periscope Data can securely connect and join data from any source, creating a single source of truth for your organization. Perform BI reporting and advanced analytics operations all from one integrated platform. Communicate insights more effectively by selecting from Periscope Data’s wide range of visualization options (including standard charts, statistical plots, maps and more) and instantly share real-time insights via direct linking, email or Slack. Periscope Data is a data analysis tool that unifies business data across multiple…
Periscope Data free trial provides fast, powerful, and flexible Analysis. Periscope Data by Sisense supports SQL, Python, and R in one editor, enabling teams to perform machine learning, natural language processing, and predictive analytics.
•One Tool For All Your Data Needs
•Enable data experts to answer more complex questions, quickly.
•SQL Editor Built By Experts, For Experts
•Advanced Analytics With Python And R
•Intuitive Drag-and-Drop Interface
Contact for Pricing
•Enable data experts to answer more complex questions, quickly.
•Intuitive Drag-and-Drop Interface
•Ensure Control, Consistency and Trust
•One Tool For All Your Data Needs
•Tailored For Every Workload
•Combine all of your data sources into a single platform for powerful analysis and insights
Google Data Studio
Google Data Studio provides easy access to all the data sources for the business to make better decisions. Regardless of whether you’re a business user or a data analyst, and no matter where the data lives, simply access it with a pre-built Data Studio connector. Data Studio handles the authentication, access rights, and structuring of the data. Once a data source is connected, the underlying dimensions and metrics are readily available for use in calculations, transformations, and visualizations. With Data Studio you’ll be able to transform your raw data into the metrics and dimensions needed to create easy-to-follow reports and…
•Visualize your data through highly configurable charts and tables.
•Easily connect to a variety of data sources.
•Share your insights with your team or with the world.
•Collaborate on reports with your team.
•Speed up your report creation process with built-in sample reports
Free
•A visual editor for easy creation of reports and dashboards.
•A rich library of visualizations to reveal the real story behind the data.
•Fully custom design and style controls so you can make it your own.
•Dynamic and interactive report controls based on time periods, geographies, segments
•Seamless integration between data, analysis, and reporting for easy workflows.
Cluvio
Cluvio is a cloud analytics platform for startups and data-driven teams, trusted by over 100 companies. Users can use SQL and R to analyze their data and in a few minutes create beautiful, interactive dashboards for their entire company. There is a wealth of information hiding in the data in the users’ database that is just waiting to be discovered. Daily active users, monthly recurring revenue, signups per day. With Cluvio, users can see the most important KPIs on interactive, real-time dashboards anywhere, anytime. Users can receive alerts for conditions that users define - a sudden drop in number of…
• Advanced Report Creator
• Interactive Dashboards
• SQL Alerts
• Bank-grade security
• EU Data Protection
• Share Dashboards via Link
• Share Dashboards with your Colleagues
• Your data on the wall
• FREE
• Pro $ 279 /mo.
• Business $ 669 /mo
• Enterprise $ 2250+ /mo.
• Custom Dashboard Filter
• Interactive Dashboards
• SQL Alerts
•Share dashboards within your company
•Share dashboards via link
•Share via email
Tableau Public
Tableau Public is a free data storytelling application used to create and share interactive charts and graphs, stunning maps, live dashboards and fun applications and publish it anywhere on the web. Tableau Public is a free service that lets anyone publish interactive data to the web. Tableau Public includes a free desktop product which can be downloaded and use to publish interactive data visualizations to the web. There is a 10 gigabyte limit on storage space for data. Tableau Public can connect to Microsoft Excel, Microsoft Access, and multiple text file formats. There is a limit of 1,000,000 rows of…
•Create interactive graphs, stunning maps
•Create Live dashboards in minutes
•Save your viz to your Tableau Public profile, and share it anywhere on the web
•Automatic mobile layouts
•Connect directly from Tableau Public to Google Sheets
•Visualization can be embedded
•Mapping experience with vector-based maps.
•Build presentation-ready dashboards
•Content saved to Tableau Public is accessible to everyone on the internet.
•Create interactive graphs, stunning maps, and live dashboards in minutes
•Visually stunning and effectively highlight your analysis
Visualize Free
Visualize Free is a Free Visualization Software for Visual Analysis. It is a free visualization software to perform data mining or explore your data with an easy to use visual analysis tool.This free analytics application is designed to be very intuitive and interactive. Visualization is the perfect technique for sifting through multi-dimensional data to spot trends and aberrations or slice and dice data with simple point-and-click methods. Visualize Free helps to visually explore and present data that standard office charting software cannot handle, and/or you're not able to install a desktop-based analytics application, Visualize Free is your free Web-based on…
•Cloud-hosted, zero-client app for data visualization and analytics
•Upload your data and drag-and-drop to create visualization dashboards
•Build an interactive visualization with a zero-client drag-and-drop designer.
•Datasets can be Excel files (XLS or XLSX) or text (CSV or tab-delimited TXT).
•Create exploratory and analytical dashboards.
•Dynamically filter a dataset and visualize the output on tables, charts, and gauges
•Discover meaningful trends and associations
•Yield actionable business intelligence
•Discover new patterns, test new ideas, and envision new opportunities
Databox Free Edition
Databox is a cloud-based business analytics platform for marketers, CEOs, analysts and decision makers that provides a single interface to view various key performance indicators (KPIs) and generate reports. It is suitable for small to large businesses and offers mobile apps for iOS and Android devices. Users can connect with various sources of cloud-based data such as HubSpot, Google Analytics, Instagram, Stripe, Facebook Ads and Moz. Users can also import data from their own databases using Databox’s REST API and SDKs. The Databox apps for iOS and Android automatically deliver daily scorecards to users’ mobile devices at specified times, and…
• Multi-dashboard view
• Custom metrics, events & statistics
• Scorecards: Get a daily or weekly summary of top KPIs
• Centralized user and notification management
• Advanced data modeling
• Desktop / TV screen view (also called a Datawall) gives immediate access to the most important information
• Free
• Multi-dashboard view
• Custom metrics, events & statistics
• Scorecards: Get a daily or weekly summary of top KPIs
• Intuitive: Use simple gestures to see and interact with the data
• Enhanced security: Enable Touch ID or passcode security to ensure that data is safe
• Easy to use: No coding required, setup in minutes
Free Open Source Business Intelligence Software


Seal Report
Seal Report is an Open Source for the Microsoft .Net Framework entirely written in C#, which offers a complete framework for producing every day reports and dashboards from any database.Seal Report focuses on an easy installation and report design. Once setup, the reports can be built and published in a minute. The main features include Dynamic SQL sources, Native Pivot Tables, HTML 5 Charts and Microsoft Charts, HTML Rendering using Razor engine, Web Report Server and Task scheduler. The Dynamic SQL sources use either the SQL or let the Seal engine build dynamically the SQL used to query the database.…
• Dynamic SQL sources
• HTML5 Rendering using Razor engine
• Native Pivot Tables
• Web Report Server
• Dynamic HTML 5 Charts or MS Charts
• Task Scheduler
Contact for Pricing
•Dynamic SQL sources
•Native Pivot Tables
•HTML 5 Charts
•Display your KPIs or published Widgets in a single view
•Schedule your report executions and generate results in folders or send them by emails
•Define tasks to perform your batch operations
Apache Superset
Superset is a data exploration platform designed to be visual, intuitive and interactive. Superset’s main goal is to make it easy to slice, dice and visualize data. Superset allows data exploration through rich visualizations while performing fast and intuitive “slicing and dicing” against just about any dataset. Data explorers can easily travel through multi-dimensional datasets while creating and sharing “slices”, and assemble them in interactive dashboards. Superset works on all most used browsers and has been built as a web app, so it does not require any additional desktop installations for power features. As such, Superset is the only tool…
• An easy-to-use interface for exploring and visualizing data
• Rich set of data visualizations
• A lightweight semantic layer, allowing to control how data sources are exposed to the user by defining dimensions and metrics
• Configurable caching options for loading dashboards
• Maps and geo support leveraging Mapbox
• User profile pages which highlight a user’s favorite dashboards/slices, created content, and recent activity
• Free
• An easy-to-use interface for exploring and visualizing data
• Rich set of data visualizations
• A lightweight semantic layer, allowing to control how data sources are exposed to the user by defining dimensions and metrics
• Out of the box authentication and authorization system, including support for LDAP, OpenID, OAuth
• Integration with most SQL-speaking RDBMS through SQLAlchemy
• Fast reaction to GitHub issues from the team
BIRT
BIRT is an open source business intelligence technology platform which are used to create data visualizations and reports. BIRT Business Intelligence platform includes BIRT Designer, BIRT Designer Pro, BIRT iHub F-Type and BIRT Analytics. These reports can be embedded into rich client and web applications. BIRT is a software project within the Eclipse Foundation, which is an independent not-for-profit consortium of software industry vendors and an open source community and the project is sponsored by Actuate along with contributions from IBM, and Innovent Solutions. BIRT has two main components, a visual report designer and a runtime component. The visual report…
• Build reports on XML data sources
• Used to build reusable component report libraries
•Allows run time modification of Data Source and Data Set public properties
Metabase
Metabase is the easy, open source way for everyone in the users’ company to ask questions and learn from data.Users can easily filter and group their data to find just what they are looking for, all without ever writing a line of sql or having to wait on a co-worker. It just takes a click to see individual records and explore connections between users’ data, so users can move from who, to what effortlessly. Users can move from their data to beautiful graphs and charts with just a few clicks. When users need to dig into the complicated stuff, Metabase…
• Activity
• Dashboards
• Open source and constantly improving.
• Free and simple to set up.
Free
• Dashboards
• Open source and constantly improving
•Let anyone on your team ask questions without knowing SQL
•SQL Mode for analysts and data pros
•Create canonical segments and metrics for your team to use
•Send data to Slack or email on a schedule with Pulses
A Reporting Tool
ART stands for A Reporting Tool and is a lightweight, multiplatform, web based query tool and reporting environment. ART is a Java Enterprise Edition web application, which can be installed it in any servlet container and any operating system with a Java Virtual Machine and can be used in any modern browser. SQL queries can be published in a few minutes. ART supports tabular, crosstab, charts, scheduling, email alerts, drill down and results are exportable to spreadsheet/pdf, can be reversed to a database table. ART provide live data via a web browser and group queries/graphs in a single dashboards, schedule…
•Providing reports via a web browser
•A number of report types e.g. tabular, charts
•A number of output formats e.g. xlsx, pdf
•Ability to have multiple reports in a single page (dashboards)
•Schedule reports
•Use existing authentication systems e.g. LDAP, Active Directory
•Simple to install, administer and use
Contact for Pricing
•A number of output formats e.g. xlsx, pdf
•Ability to have multiple reports in a single page (dashboards)
•Schedule reports
•ART is a lightweight, multi-platform,
•Web application
ReportServer Community Edition
ReportServer is the modern and versatile business intelligence (OSBI) platform for users’ company. ReportServer Community Edition is open source software under the aGPL. Pixel-perfect reporting, ad-hoc analyses, Excel and Word reporting or multidimensional OLAP analytics: ReportServer comes with a great selection of powerful tools. ReportServer's Dynamic List is a powerful yet intuitive tool to create and manage ad-hoc analyses. The Dynamic List is the preferred method in ReportServer for fast and user specific analyses of data. The real data (i.e., the raw data) for user reports is usually stored within in tables (aka. lists). With ReportServer's Dynamic List users can…
• Eclipse BIRT
• Ad-Hoc Reporting
• Jasper Reports
• OLAP & Mondrian
• SAP Crystal Reports
• Office Templates
• Script Reports
Free
•Powerful tool for the ad-hoc generation of list-like reports
•Supports various output formats from Microsoft Excel over PDF to XML
•Comes with audit-proof documentation
•Variety of parameters to allow for customization of reports
•Present all key performance indicators on a single page
•Unlimited dashboards per user
ReportServer Community Edition
SQL Power Wabit
The SQL Power Wabit empowers database & business users around the world to perform ALL their reporting and analytics from one straightforward, easy-to-use interface.Recognizing that end-users struggling with overly-complex BI Tools is the number one reason why Business Intelligence projects fail to deliver the desired ROI, SQL Power Wabit was designed to conquer this primary issue. Although there are many BI Reporting tools on the market (both proprietary and Open Source), most of these tools are fairly difficult to use and require one or more days of training before a user can get started. Committed to providing business users around…
• Standard Reports
• Custom Dashboards
• Ad-hoc Queries
• Line, Bar & Pie Charts
• Drill-down OLAP cubes
• Real-time BI Reporting
Free
• Standard Reports
• Custom Dashboards
• Real-time BI Reporting
Widestage
WideStage is a self-service reporting tool which is lightweight and powered by NodeJS. Semantic Layers allow users to query data without knowing how the data is structured and using business terms instead of SQL or complex query languages. Users can let others create their own reports with WideStage self-service business intelligence. Users can empower others with capabilities for creating their own reports and dashboards, with an easy to use and intuitive tool, while eliminates the tedious work to develop and prepare reports. Widestage makes it easy for users to create a report or dashboard. Widestage drag and drop capabilities along…
• self service reporting tool
• Lightweight, powered by NodeJS.
• Intuitive and modern front-end, powerful back-end
• Reporting with a semantic layer
• Supports Joins between collections
• Nested elements
Free
Free Proprietary Business Intelligence Software


Cluvio
Cluvio is a cloud analytics platform for startups and data-driven teams, trusted by over 100 companies. Users can use SQL and R to analyze their data and in a few minutes create beautiful, interactive dashboards for their entire company. There is a wealth of information hiding in the data in the users’ database that is just waiting to be discovered. Daily active users, monthly recurring revenue, signups per day. With Cluvio, users can see the most important KPIs on interactive, real-time dashboards anywhere, anytime. Users can receive alerts for conditions that users define - a sudden drop in number of…
• Advanced Report Creator
• Interactive Dashboards
• SQL Alerts
• Bank-grade security
• EU Data Protection
• Share Dashboards via Link
• Share Dashboards with your Colleagues
• Your data on the wall
• FREE
• Pro $ 279 /mo.
• Business $ 669 /mo
• Enterprise $ 2250+ /mo.
• Custom Dashboard Filter
• Interactive Dashboards
• SQL Alerts
•Share dashboards within your company
•Share dashboards via link
•Share via email
QlikView Personal Edition
QlikView, is the leading Business Discovery Platform, providing user driven business intelligence (BI) to a variety of organizations worldwide. QlikView makes data associative, creating easily-understandable visual relationships across multiple, complex data sources. It’s also mobile, social and collaborative. QlikView Personal Edition is the full QlikView Desktop product that is run on a machine without a customer or partner license assigned to it. With the QlikView Personal Edition license, everyone is free to create QlikView documents for personal use. If at any point you or your organization decides to acquire a full QlikView license, this Personal Edition installation will automatically become…
•Consolidate data from Multiple sources
•Collaboration, Visualization, Search, Graphics
•Dashboard, Mobile BI
•Bring together all your data and unlock its full potential
•Searching across all data, interacting with dynamic apps, dashboards and analytics
•Accessing, analyzing and capturing data from mobile devices .
•Consolidate from multiple sources into a single application,
•Exploring the associations in data, enabling social decision making through secure,
•Real time collaboration, visualizing data with engaging, state-of-the-art graphics,
•QlikView Personal Edition works with local files only and cannot share QlikView file with another unregistered user, or load a QlikView file from another user.
•Not possible to import an entire document layout sheets/objects/security settings, etc. without the data.
Kyubit Business Intelligence
Kyubit Business Intelligence is a Business intelligence tool that is designed for Microsoft BI environment and 'Analysis Services' (Multidimensional and Tabular models) OLAP analysis using web browser. Its dashboard software can be used to create visual insights and metrics and also collaborate with other users while monitoring business data and managing KPIs. Kyubit Business Intelligence allows users to convert their analysis to PDF or Excel file, share with the team or subscribe to fresh data at scheduled time. It can also Analyze OLAP data with descriptive Grid view or visual Chart view. Kyubit Business Intelligence’s interactive dashboard allows users to…
•Modern big data architecture
•Cloud or on-premise
•Extensible data model
•Scalable for enterprise
•Revenue distribution models
•Based on multiple channels
•Free Personal Edition
•Team Edition $295 Per Year
•Standard Edition $495 Per Year
•Company Edition $895 Per Year
•Modern big data architecture
•Cloud or on-premise
•Extensible data model
•Interactive Dashboards can be accessed from desktop or mobile devices.
•Kyubit BI Tools user interface includes multilingual support
•Works as on-premise BI server or part of your cloud BI environment
EspressReport Lite
EspressReport Lite is a Java report development tool kit. It comes with a powerful, high performance reporting engine and a visual report builder. You can easily build embedded reporting functionality into your web based or standalone applications. It provides the same capabilities as EspressReport except that sub-reports, drill-down, embedded charts and scheduling are not supported. Quadbase Systems, Inc, a leading supplier of web-based business intelligence and data visualization solutions, launched the release of version 6.6 of EspressDashboard. EspressDashboard is a web based enterprise business intelligence (BI) dashboard development and publishing system. It is designed to be easily used by non-programmers…
•You can easily build embedded reporting functionality
•Works with web based or standalone applications.
•High performance reporting engine and a visual report builder
•Distribute the reporting engine to your end user
•Provides the same capabilities as EspressReport except that sub-reports, drill-down, embedded charts and scheduling are not supported.
Arcadia Data Instant
Arcadia Data Instan uses smart acceleration to enable ultra-fast analytics and BI with agile drag-and-drop access. Arcadia Data Instant provides an in-cluster execution engine for scale-out performance on Apache Hadoop and other modern data platforms with no data movement. Arcadia Data Instant supports visualizations on Apache Kafka. Through this, users have an excellent platform to download a kit quickly and get started with exploring visualizations of Kafka topics. The key features offered by Arcadia Data Instant include connect, discover, model, visualise, interact, manage, scale, optimize, security, share and publish, and advanced analytics. The connect feature allows accessing data inside Hadoop…
• The discover feature provides browse data sources, structure and content, with full granularity and transparency
• Set hierarchies and logical datasets, for blending visualizations across sources
• The visualize feature provides easy to use familiar web-based self-service drag and drop authoring
• Flow and funnel algorithms that make it easy to measure correlation
• Create semantic relationships across multiple sources
• Assemble dashboards and applications of visuals that show the user’s work
Contact for pricing
• The discover feature provides browse data sources, structure and content, with full granularity and transparency
• Set hierarchies and logical datasets, for blending visualizations across sources
• The visualize feature provides easy to use familiar web-based self-service drag and drop authoring
• Provides an in-cluster execution engine for scale-out performance on Apache Hadoop
• Achieve linear scalability of records with native in-cluster execution
• Simplifies deployment and monitoring with certified integration
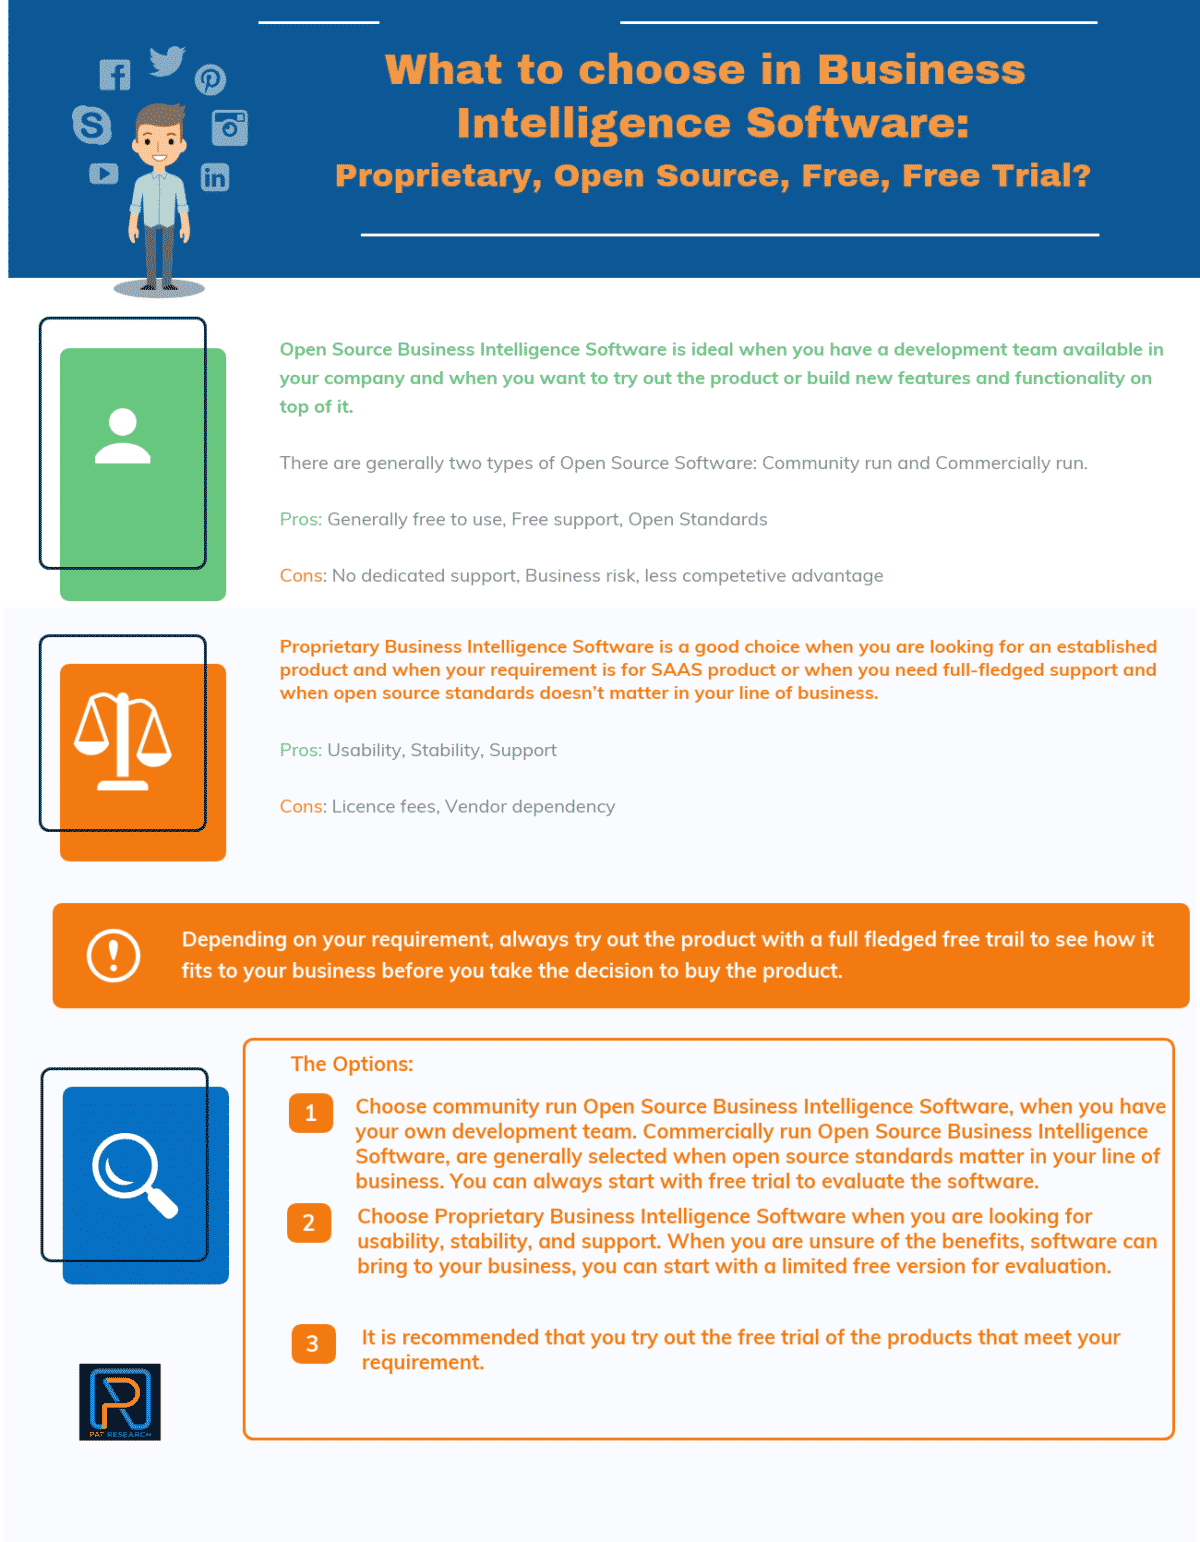
What to Choose: Proprietary or Open Source Business Intelligence Software? How about Free Business Intelligence Software?
From a buying perspective there are two options based on the source code availability: Open Source Software and Proprietary Software. You will find free or limited free versions in both the Open Source Software and Proprietary Software.
Open Source Business Intelligence Software: Open Source Business Intelligence Software is ideal when you have a development team available in your company and when you want to try out the product or build new features and functionality on top of it.
Proprietary Business Intelligence Software: Proprietary Business Intelligence Software is a good choice when you are looking for an established product, when your requirement is for SAAS product or when you need full-fledged support and when open source standards doesn’t matter in your line of business.
You may want to review How to Select the Best Business Intelligence Software for Your Business
What to Choose Proprietary or Open Source Business Intelligence Software How about Free Business Intelligence Software
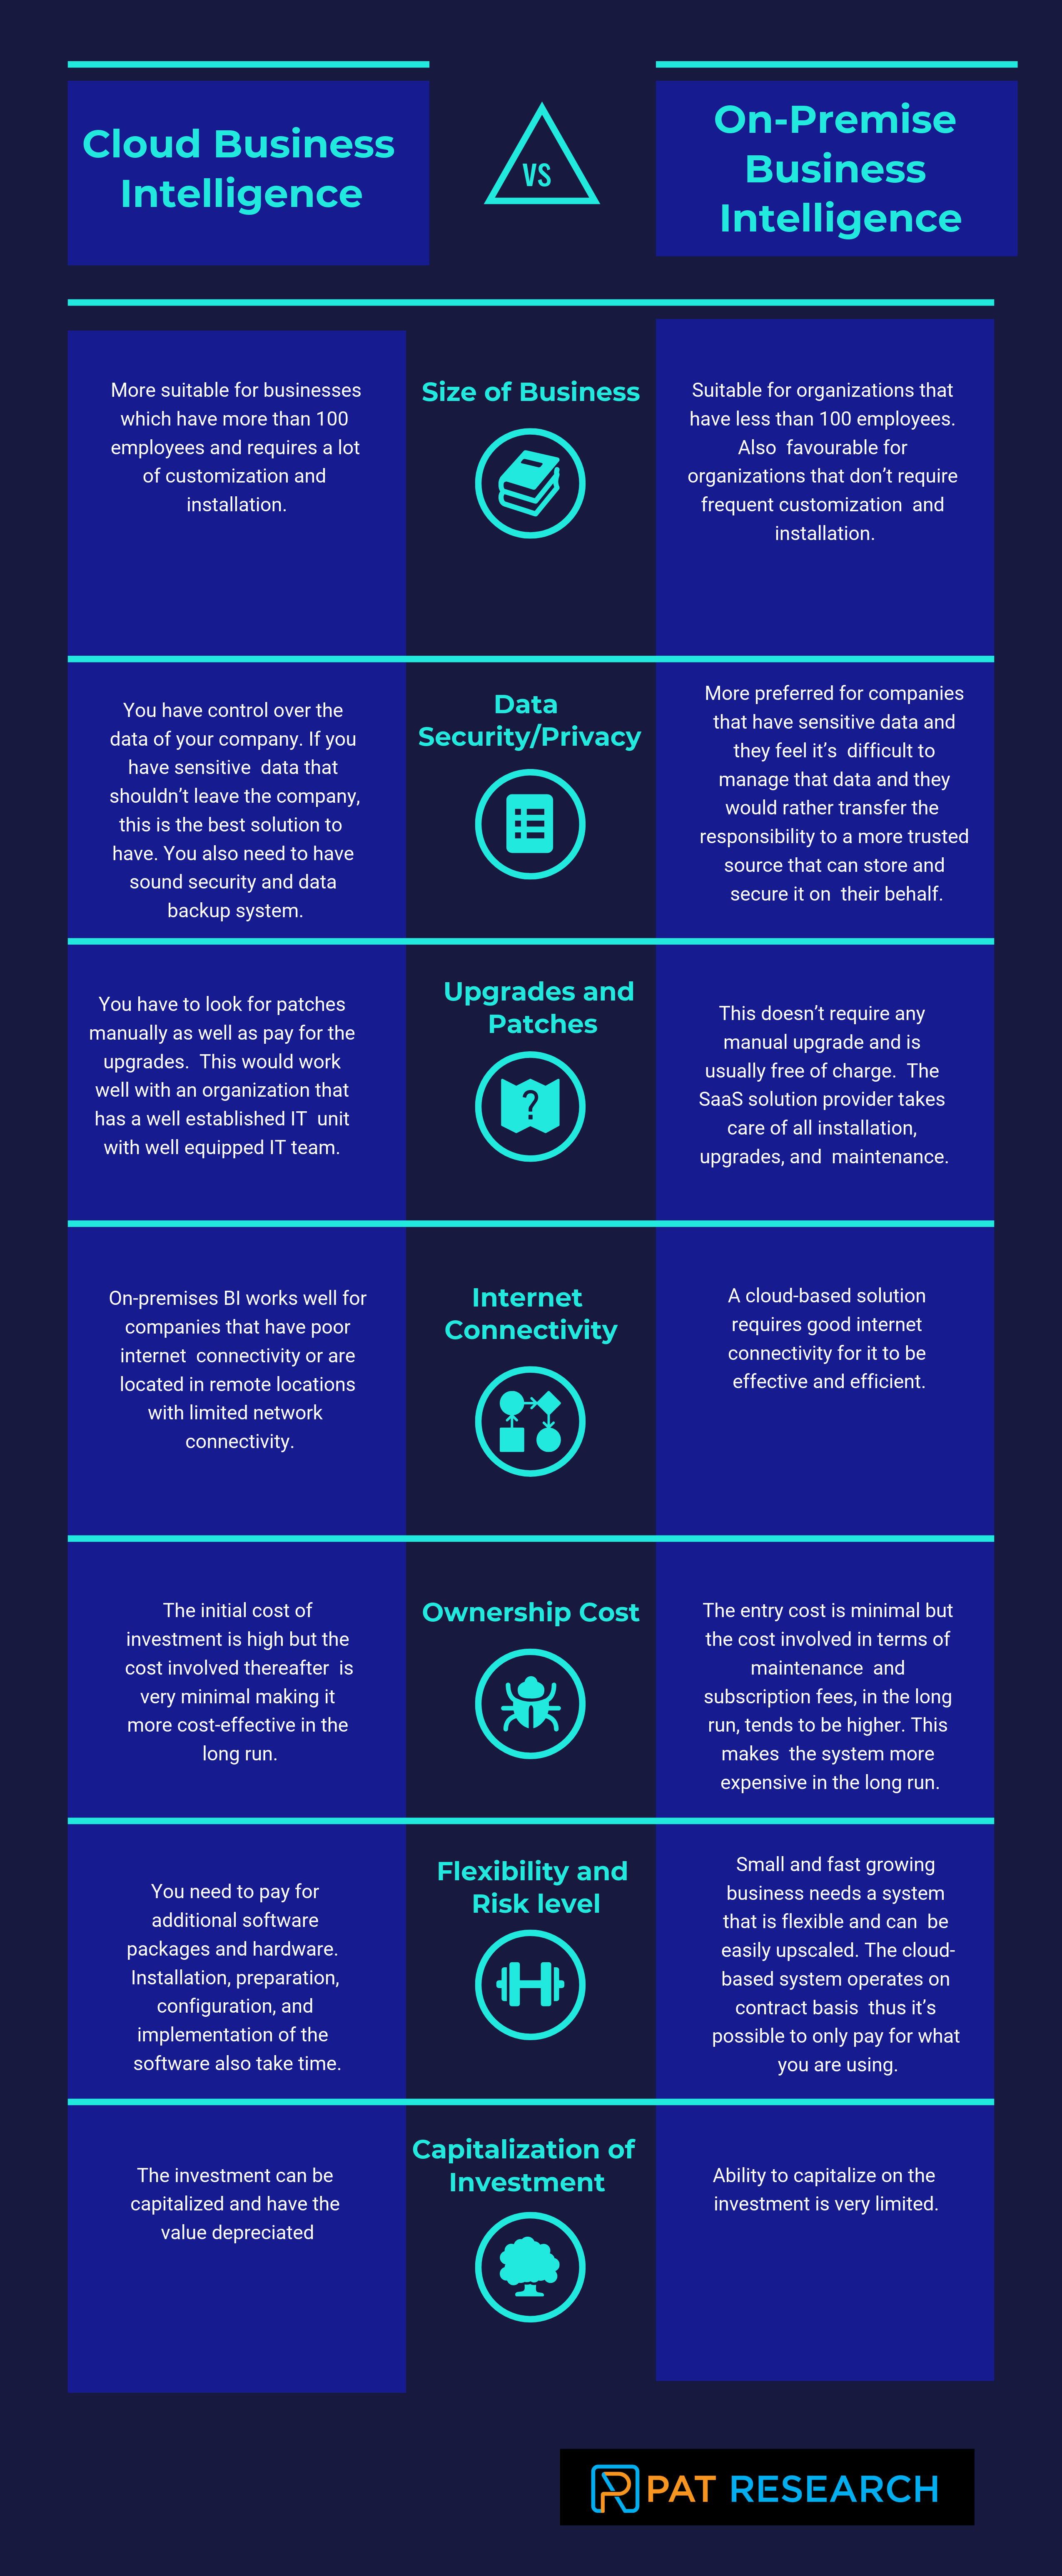
Choosing between Cloud vs On premise Business Intelligence Software?
The type of Business Intelligence Software you implement should have an operational efficiency and business growth. Organizations should choose a system that will accelerate business productivity while at the same time improving employee engagement.
It is important to understand the advantages and disadvantages associated with each system before deciding on which one to settle for.
Choosing between Cloud vs On premise Business Intelligence Software
You may want to review How to Select the Best Dashboard Software for Your Business
What are Business Intelligence Software?
Business Intelligence Software allows users to collect, sort, organize, analyze and present data into easy-to-understand information for insights. Companies use the software to gain insights from their data and create reportable data sets. The software can collate data from various sources such as relational databases, XML data sources, and other data streams.
What are the Best Free Cloud Business Intelligence Software?
Sisense, Periscope Data, Google Data Studio, Cluvio, Tableau Public, Visualize Free, Databox Free Edition are some of the Top Free Cloud Business Intelligence Software.
What are the Best Free Open Source Business Intelligence Software?
Seal Report, Apache Superset, BIRT, Metabase, A Reporting Tool, ReportServer Community Edition, SQL Power Wabit, Widestage are some of the Top Open Source Business Intelligence Software.
What are the Best Free Proprietary Business Intelligence Software?
Cluvio, QlikView Personal Edition, Kyubit Business Intelligence, EspressReport Lite, Arcadia Data Instant are some of the Top Free Proprietary Business Intelligence Software.


ADDITIONAL INFORMATION
Thanks for the list, didn’t know about some of the software on the list. One more to add to your list is ART, http://art.sourceforge.net. Supports OLAP via Mondrian, JasperReports, Excel reports and simple SQL reports. Lesser know but in my opinion the ideal tool for smaller environments.
ADDITIONAL INFORMATION
Thank you for your listing.
If you are in the Windows world, may I suggest also to have a look at Seal Report (http://sealreport.codeplex.com/), this open source reporting tool is 100% .Net C# and focus on operational reporting…
ADDITIONAL INFORMATION
Which are BI Tools good for ‘customization of BI software’
Thanks in advance
ADDITIONAL INFORMATION
Thanks for the list. In your section dedicated to Pentaho, you define it as a Free Open Source BI Software with no restriction, but If you access directly to Pentaho website to download the product, you’ll find only a 30 days trial version… It is not a free open source actually … not now.
ADDITIONAL INFORMATION
Here is another open source business intelligence tool http://widestage.com is lightweight and powered by NodeJS, works with mongodb, postgresql, mysql, and MSsql data
ADDITIONAL INFORMATION
I would like to add one more open source BI tool to the list i.e Helical Insight (http://www.helicalinsight.com)
It has Inbuilt workflow, API driven UI and Instant BI.
ADDITIONAL INFORMATION
I would like to recommend CBoard for you, which is an open BI Dashboard platform that supports interactive multi-dimensional report design and data analysis.
(https://github.com/yzhang921/CBoard)
ADDITIONAL INFORMATION
One more free cloud tool for quick ad-hoc reporting (pivot tables, charts): https://www.seektable.com/
You can upload CSV data (up to 500mb) or connect directly to SQL database or even MongoDb.
ADDITIONAL INFORMATION
There is also Abixen Platform ( http://www.platform.abixen.com ) which is not a clear BI tool, but contains a module for dashboards and charts creation. It’s a startup for now, but grows quickly on GitHub.