Sign in to see all reviews and comparisons. It's Free!
By clicking Sign In with Social Media, you agree to let PAT RESEARCH store, use and/or disclose your Social Media profile and email address in accordance with the PAT RESEARCH Privacy Policy and agree to the Terms of Use.
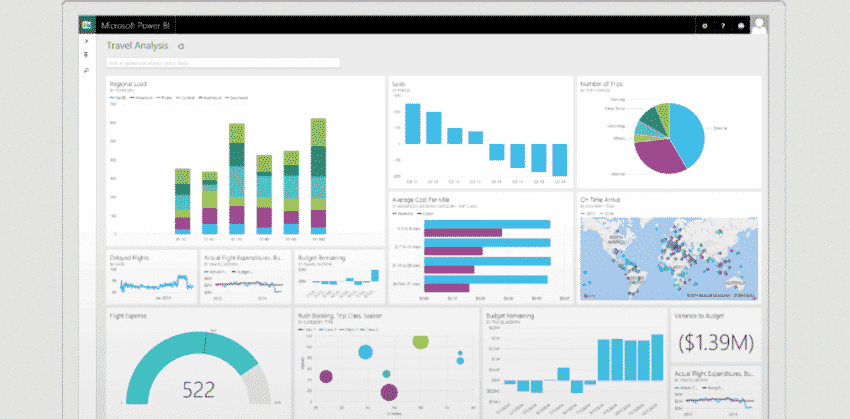
Microsoft Power BI, is a cloud based, software as a service, self-service business intelligence solution for non technical business users.
Category
Business Intelligence Software
Sub Category
Self Service Analytics Software, Data Visualization Software, Dashboard Software, Reporting Software, Cloud Business Intelligence Software
Features
• Noisy neighbors isolation • Huge dataset storage and no user quotas • Higher dataset refresh rates • Large datasets
License
Proprietary
Price
•Power BI Pro-$9.99- Monthly price per user •Power BI Premium-$4,995 - Monthly price per dedicated cloud compute and storage resource
Pricing
Subscription
Free Trial
Available
Users Size
Small (<50 employees), Medium (50 to 1000 Enterprise (>1001 employees)
Company
Microsoft
What is best?
• Noisy neighbors isolation • Huge dataset storage and no user quotas • Higher dataset refresh rates • Large datasets • Incremental refresh
What are the benefits?
• Incremental refresh • Pinning Datasets to Memory • Dedicated Data Refresh Nodes • Read-Only Replicas • Geographic distribution • Road map cautions
PAT Rating™
Editor Rating
Aggregated User Rating
Rate Here
Ease of use
8.9
6.3
Features & Functionality
9.0
7.2
Advanced Features
9.0
7.4
Integration
8.9
7.7
Performance
9.1
7.1
Customer Support
9.1
7.2
Implementation
7.5
Renew & Recommend
7.3
Bottom Line
Power BI let you connect to your data in minutes, with built in connectors and pre built dashboards and reports from a wide variety of sources
9.0
Editor Rating
7.3
Aggregated User Rating
35 ratings
You have rated this
Microsoft Power BI, is a cloud based, software as a service, self-service business intelligence solution for non technical business users. With just any browser or a Power BI mobile app, customers can keep a pulse on their business via live operational dashboards. They can deeply explore their business data, through interactive visual reports, and enrich it with additional data sources.
The first version of Power BI was launched last February and since then customers have used it to gain powerful insights, helping them become more productive and competitive.
Power BI let you connect to your data in minutes, with built in connectors and pre built dashboards and reports from a wide variety of sources including GitHub, Marketo, Microsoft Dynamics CRM, Salesforce, SendGrid and Zendesk. Inkling Markets, Intuit, Microsoft Dynamics Marketing, Sage, Sumo Logic, Visual Studio Application Insights, Visual Studio Online, and many more are planned for future. Power BI Designer is a dedicated report authoring tool for the Power BI Preview service.
The Power BI Designer provides rich data transformation and visual analytics in a unified, seamless experience. The Power BI Designer enables to create impactful reports with state of the art interactive charts, maps, graphs, and data transformations.
This enables the business to upload their reports to the Power BI preview and empower others with timely critical insights on any device, anywhere.
Filtering just by dragging is easy to do and no tech skills required so it saves users time and effort to make visualizations as they like.
Company size
Medium (50 to 1000)
User Role
Super User
User Industry
Food
Rating
Ease of use9
Dragging data from the left pane of the screen and dropping them into the canvass easily makes a visualization and if users want to change the visualization recommended they can go to the gallery to select what they like.
Features & Functionality8.4
Filtering is also quite easy by dragging the data into the filter the user is interested in and the filter used automatically displays on the visualization.
Advanced Features8.2
Integration9
Adding pages to a report is simple and easy by clicking a plus button on the bottom of the canvas and can also be clicked to go to the other pages.
Performance8.3
Training 8.2
Customer Support8.7
Implementation8.4
Renew & Recommend8
ADDITIONAL INFORMATION Power Bi has functions which is similar to the different Microsoft office applications so users of MS office can get accustomed to it in no time.
Reports are flexible and can be saved anywhere and can be accessed offline so the reports can view anytime and anywhere even without connection.
Company size
Small (<50)
User Role
IT Support
User Industry
Energy
Rating
Ease of use8.8
Easily load the data from the users’ data source by selecting them on get data tool. When loaded then users can see the title of the columns displayed on the right pane.
Features & Functionality8.4
Advanced Features8
Users can choose to save the reports locally, pin the reports to dashboards or publish it for the users’ organization to view.
Integration8.1
Get data tool provides all sources the power bi supports and when clicked users can select the data they are interested in.
Performance8.3
Training 8.2
Customer Support7.6
Implementation8.1
Renew & Recommend8.2
ADDITIONAL INFORMATION With clicking, ticking boxes and dragging and dropping the power Bi can easily be handled and used by end-users or pros.
A Business analytics tool that delivers insight throughout your organisation.
Company size
Enterprise (>1001)
User Role
End User
User Industry
Aerospace
Rating
Ease of use8.2
Features & Functionality8.3
Advanced Features8.1
Integration8.2
Training 8.2
Customer Support8.2
ADDITIONAL INFORMATION The software is a cloud based business analytics service that merges all business data in a single view; power bi mobile apps also allow easy access of your business at any particular time. Easy access of your business, rich interactive reports with visual analytics are readily available.
Live and real-time dashboards and interactive visual reports. Go from data to insights fast.
Company size
Small (<50)
User Role
IT Support
User Industry
Chemical
Rating
Ease of use8.2
Features & Functionality8.3
Advanced Features8.1
Integration8.2
Performance8.2
Training 8.2
Customer Support8.2
Renew & Recommend8.2
ADDITIONAL INFORMATION Connect to hundreds of data sources, simplify data preparation, and drive ad hoc analysis. Simplify management, achieve compliance and keep data secure. Instantly know when your business needs your attention with real-time Power BI dashboards. Solve problems as they occur and seize opportunities as soon as they arise.
Generate insights throughout your organization by connecting to hundreds of data sources, simplifying data prep, and driving ad hoc analysis.
Company size
Enterprise (>1001)
User Role
Consultant
User Industry
Pharmaceutical
Rating
Ease of use8.3
Features & Functionality8.2
Advanced Features8.2
Integration8.3
Implementation8.1
Renew & Recommend8.3
ADDITIONAL INFORMATION Microsoft power bi – a cloud-based business analytics service that gives you a single view of your most critical business data. Monitor the health of your business using live dashboard. Create rich interatcive reports with Power BI desktop and access your data on the go with native Power BI Mobile apps.


Users get accustomed in no time
Filtering just by dragging is easy to do and no tech skills required so it saves users time and effort to make visualizations as they like.
Medium (50 to 1000)
Super User
Food
Dragging data from the left pane of the screen and dropping them into the canvass easily makes a visualization and if users want to change the visualization recommended they can go to the gallery to select what they like.
Filtering is also quite easy by dragging the data into the filter the user is interested in and the filter used automatically displays on the visualization.
Adding pages to a report is simple and easy by clicking a plus button on the bottom of the canvas and can also be clicked to go to the other pages.
ADDITIONAL INFORMATION
Power Bi has functions which is similar to the different Microsoft office applications so users of MS office can get accustomed to it in no time.
Flexible Easy to Use Reporting
Reports are flexible and can be saved anywhere and can be accessed offline so the reports can view anytime and anywhere even without connection.
Small (<50)
IT Support
Energy
Easily load the data from the users’ data source by selecting them on get data tool. When loaded then users can see the title of the columns displayed on the right pane.
Users can choose to save the reports locally, pin the reports to dashboards or publish it for the users’ organization to view.
Get data tool provides all sources the power bi supports and when clicked users can select the data they are interested in.
ADDITIONAL INFORMATION
With clicking, ticking boxes and dragging and dropping the power Bi can easily be handled and used by end-users or pros.
A Business analytics tool that delivers insight throughout your organisation.
Enterprise (>1001)
End User
Aerospace
ADDITIONAL INFORMATION
The software is a cloud based business analytics service that merges all business data in a single view; power bi mobile apps also allow easy access of your business at any particular time. Easy access of your business, rich interactive reports with visual analytics are readily available.
Live and real-time dashboards and interactive visual reports. Go from data to insights fast.
Small (<50)
IT Support
Chemical
ADDITIONAL INFORMATION
Connect to hundreds of data sources, simplify data preparation, and drive ad hoc analysis. Simplify management, achieve compliance and keep data secure. Instantly know when your business needs your attention with real-time Power BI dashboards. Solve problems as they occur and seize opportunities as soon as they arise.
Generate insights throughout your organization by connecting to hundreds of data sources, simplifying data prep, and driving ad hoc analysis.
Enterprise (>1001)
Consultant
Pharmaceutical
ADDITIONAL INFORMATION
Microsoft power bi – a cloud-based business analytics service that gives you a single view of your most critical business data. Monitor the health of your business using live dashboard. Create rich interatcive reports with Power BI desktop and access your data on the go with native Power BI Mobile apps.