Sign in to see all reviews and comparisons. It's Free!
By clicking Sign In with Social Media, you agree to let PAT RESEARCH store, use and/or disclose your Social Media profile and email address in accordance with the PAT RESEARCH Privacy Policy and agree to the Terms of Use.
Small (<50 employees), Medium (50 to 1000 Enterprise (>1001 employees)
Company
Lumalytics
URL
https://www.lumalytics.com/
What is best?
•Ad hoc reports •Dashboard •Data analysis •Data visualization •Connect to various data sources
What are the benefits?
• Create dashboards with charts, data tables and filters • Display real-time data from your own data sources. • Write sql queries to retrieve the data you want • Choose how to display your data on your dashboard • Allow companies of all sizes to be data centric
PAT Rating™
Editor Rating
Aggregated User Rating
Rate Here
Ease of use
7.5
8.3
Features & Functionality
7.6
8.3
Advanced Features
7.5
8.3
Integration
7.4
8.1
Performance
7.4
8.1
Customer Support
7.6
8.4
Implementation
8.1
Renew & Recommend
8.0
Bottom Line
Lumalytics connect to your data source (database or csv file), create a dashboard and write SQL queries to retrieve the data you want and choose how to display it on your dashboard.
7.5
Editor Rating
8.2
Aggregated User Rating
3 ratings
You have rated this
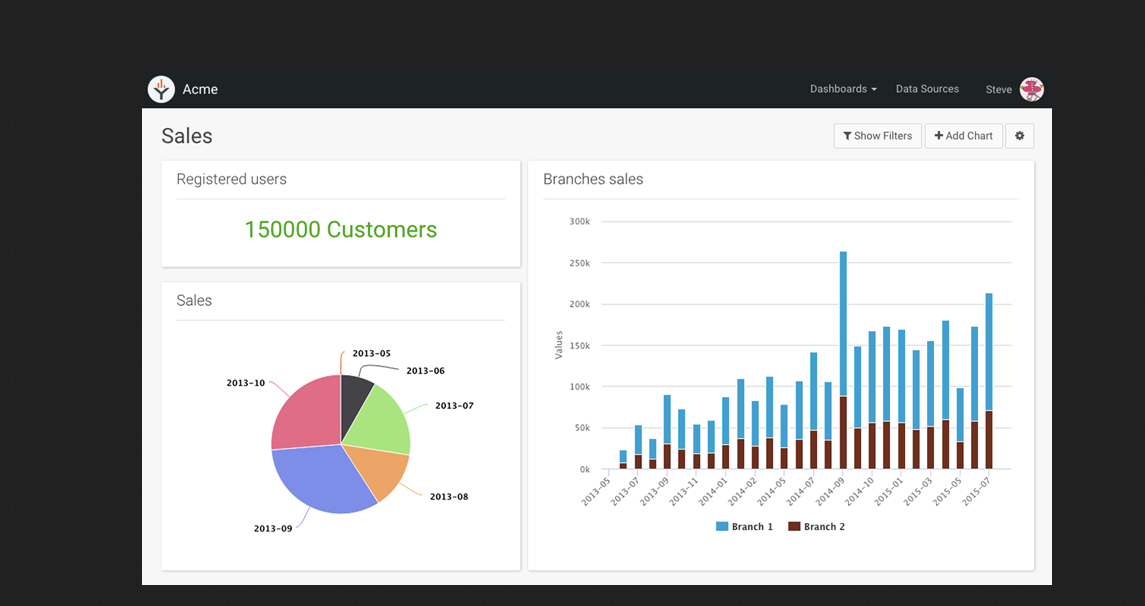
Lumalytics lets you create dashboards with charts, data tables and filters that display real-time data from your own data sources. Lumalytics connect to your data source (database or csv file), create a dashboard and write SQL queries to retrieve the data you want and choose how to display it on your dashboard.
Lumalytics is a SAAS tool that create dashboards with charts, data tables and filters that display real-time data from various data sources. First, users must connect to their data source (database or csv file). Lumalytics supports connecting to Postgres, SQL Server, mySQL and Amazon Redshift.
Users can also upload their own CSV file. Lumalytics allows creating a dashboard with writing SQL queries to retrieve the wanted data and choosing how to display it on users’s dashboard.
They can write SQL queries to pull in exactly the data they want to display. Also, Lumalytics allows writing queries for uploaded CSV files.If users want to show a chart for specific dates or a specific dropdown they can add filters (e.g. date range, category dropdown) that allow them to do that.
Create dashboards with charts, data tables and filters that display real-time data from different data sources.
Company size
Small (<50)
User Role
End User
User Industry
Transportion
Rating
Ease of use8.2
Features & Functionality8.1
Advanced Features8.4
Integration8.2
Performance8.2
Implementation8.2
ADDITIONAL INFORMATION Lumalytics – business intelligence software that allows companies of all sizes to be data centric, creates dashboards and writes SQL queries. Support for multiple data sources. Share dashboards with a public URL or embed it within sites or apps. Make business decisions based on data with easy understandable dashboards.
Lets users pull data from various databases or csv files
Company size
Enterprise (>1001)
User Role
Consultant
User Industry
Agriculture
Rating
Ease of use8.4
Features & Functionality8.4
Advanced Features8.2
Integration8.1
Performance8.1
Implementation8.1
ADDITIONAL INFORMATION Lumalytics lets users pull data from various databases or csv files. Lumalytics supports connecting to Postgres, MySQL, SQL Server and Amazon Redshift. Lumalytics also lets users use SQL to retrieve the data users want to display. Such that users can write SQL queries to pull in exactly the data users want and then choose how they want to display it. Lumalytics even allows users to write queries for uploaded CSV files. Lumalytics also lets users add filters to build interactive dashboards by being interactive. So if users only want to show a chart for specific dates or a specific dropdown, users can just add filters such as date range or category dropdown that allow users to customize the look and feel of their dashboards. Lumalytics also lets users define a custom color scheme, company logo and other content to ensure their dashboards look exactly how they want. Users can also share their dashboard with a public URL or embed it within their own site or app.


Create dashboards with charts, data tables and filters that display real-time data from different data sources.
Small (<50)
End User
Transportion
ADDITIONAL INFORMATION
Lumalytics – business intelligence software that allows companies of all sizes to be data centric, creates dashboards and writes SQL queries. Support for multiple data sources. Share dashboards with a public URL or embed it within sites or apps. Make business decisions based on data with easy understandable dashboards.
Lets users pull data from various databases or csv files
Enterprise (>1001)
Consultant
Agriculture
ADDITIONAL INFORMATION
Lumalytics lets users pull data from various databases or csv files. Lumalytics supports connecting to Postgres, MySQL, SQL Server and Amazon Redshift. Lumalytics also lets users use SQL to retrieve the data users want to display. Such that users can write SQL queries to pull in exactly the data users want and then choose how they want to display it. Lumalytics even allows users to write queries for uploaded CSV files. Lumalytics also lets users add filters to build interactive dashboards by being interactive. So if users only want to show a chart for specific dates or a specific dropdown, users can just add filters such as date range or category dropdown that allow users to customize the look and feel of their dashboards. Lumalytics also lets users define a custom color scheme, company logo and other content to ensure their dashboards look exactly how they want. Users can also share their dashboard with a public URL or embed it within their own site or app.