Sign in to see all reviews and comparisons. It's Free!
By clicking Sign In with Social Media, you agree to let PAT RESEARCH store, use and/or disclose your Social Media profile and email address in accordance with the PAT RESEARCH Privacy Policy and agree to the Terms of Use.
Business Intelligence
Now Reading
Location Intelligence,Visualisation and CSV support in Yellowfin
Location Intelligence,Visualisation and CSV support in Yellowfin
Location Intelligence, Visualisation and CSV support in Yellowfin : Yellowfin is a web based platform for Business Intelligence and analytics in the cloud. Yellowfin is a leader in mobile, collaborative and embeddable BI as well as Location Intelligence and data visualization. Yellowfin 7.1 extends the three core technical areas, by boosting Location Intelligence capabilities, improving CSV support and increasing the number of visualizations supported by Yellowfin’s Auto Chart functionality.Yellowfin simplifies world class Location Intelligence, making it accessible to users of all types and organizations of all sizes, through the introduction of native Base Layers and GeoPack. Yellowfin contains a native Base Map for the world, including detailed levels for zoomed in analysis which enable to create beautiful maps with ease. Instead of pulling a map layer from a third party source such as Google Maps, Yellowfin uses shape files to create an image, native Base Layer. It will make it possible to export multi layered maps, complete with Base Layer, straight to PDF to collaborate and share with colleagues.
Yellowfin comes with GIS records and geometry points, enabling to quickly turn address data into stunning maps. Yellowfin enable to geocode address data to zip code level on the fly, and render this information on maps with ease,to quickly produce stunning visualizations and actionable insight. Yellowfin automatically assign zip codes, latitude and longitude coordinates as well as polygons. Yellowfin also comes with demographic data for key regions including population, average household income, median age, employment information and more. These data sets will assist to quickly detect correlations or interrelations hips between existing business and spatially relevant third party data. Yellowfin’s Auto Chart feature automatically identify while using geometry data and instantly create a suggested map based on your selected fields such as GIS, bubble or heat.
Yellowfin’s Auto Chart feature instantly create combination charts when you combine multiple metrics with dimensional data. Auto Chart now supports over 50 best practice chart types and combinations. Any combination of attributes dragged into Yellowfin’s Chart Builder will now create an Auto Chart of the selected metric. The Auto Chart feature is designed to give further assistance to non technical business users,to enable self-service content creation and independent Data Discovery.
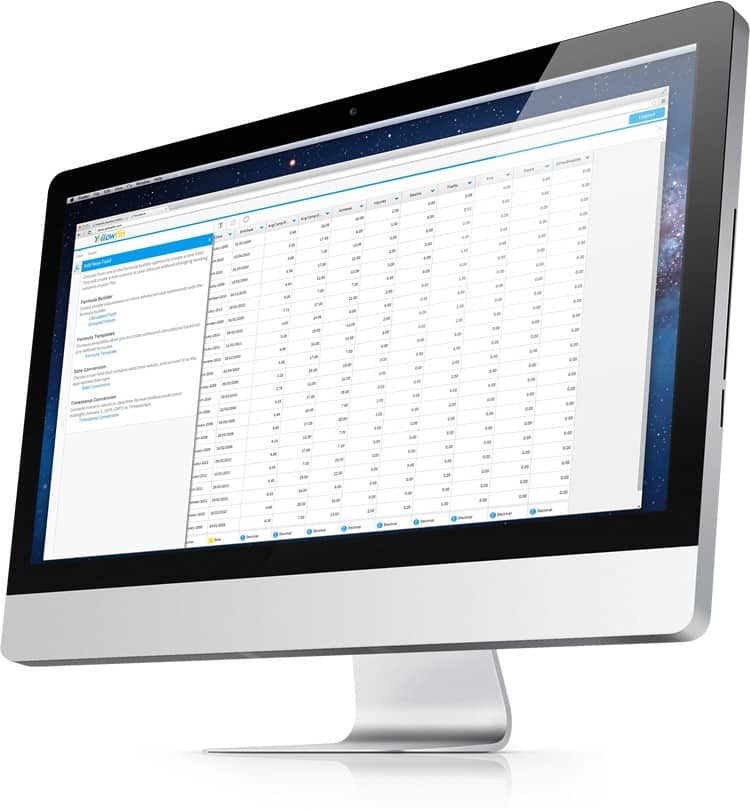
For Loading CSV files, the import user interface allows users to simply select a CSV file, drag it onto the canvas, instantly visualize all fields in the spreadsheet, and then load it straight into Yellowfin for reporting. Each column within a spreadsheet is clearly denoted with an icon and label to help users quickly identify measures and dimensions. Calculations, column formatting and date parsing also make CSV data more flexible to use.
The CSV data preview process in Yellowfin makes it quick and easy to understand CSV-based datasets and manipulate them appropriately. Fields can be added or formatted with ease, from building custom formulas to date, text or geography conversion in a single step. Users can also easily create formulas, add in formula templates and create Derived Fields. Advanced help features assist users through each step of the content creation and formatting process. Column color-coding also reminds users of any formatting options that have been applied.
Location Intelligence, visualisation and CSV support in Yellowfin


By clicking Sign In with Social Media, you agree to let PAT RESEARCH store, use and/or disclose your Social Media profile and email address in accordance with the PAT RESEARCH Privacy Policy and agree to the Terms of Use.