
Buyer Guide: Selecting the Right Dashboard Type for Your Business

In today’s business world, where companies and industries have to manage their vast data-driven environments and stiff competition, business has to incorporate business intelligence attributes to succeed. BI has enabled many organizations to build their enterprises into a successful empire, and with that others, features from the tools have been developed to continue the legacy.
There is a lot of buzz going around the corporate world about business dashboard you would probably wonder indeed, what is the purpose of the dashboard and is it necessary to your enterprise. Here is a scenario where businesses may genuinely understand the need of dashboard in their enterprises:
An organization has been able to collect meaningful data, then the question one could ask is, “Now what?” It’s quite strange to meet with executives, and they inform you they have a magnitude of data, but they are unable to convert the data into meaningful information to the advantage of their business.
With the use of right information and application of the right data reporting solution in the dashboard, the business can be able to tackle these challenges and make great improvements in their business process. So whether you are a startup or large corporation, there are a couple of ways you can incorporate dashboards to your corporation to succeed.
What is the purpose of a Dashboard?
Before you decide whether there is a need for dashboard software in your business, it is good to understand what a business dashboard is. A dashboard is a visualization tool for data, which displays and analyzes key performance indicators (KPIs) and quantifiable measures for a specific process, department or a business as a whole.
With just one glance, dashboards give businesses users multiple of insights that are important to their business. A dashboard can as well be used to define metrics, predominantly identify problems and set performance goals for the business. Some of the most important features of business intelligence dashboard include its ability to bring out real-time data or information from a couple of sources and its customizable interface.
The purpose of a dashboard is to provide a centralized, graphical representation of key performance indicators (KPIs) and other important data that is relevant to a specific business process or decision. Dashboards are designed to give users a quick and easy way to understand the current state of their business and identify trends and patterns that can help inform better decision-making. Dashboards typically include a range of visualizations, such as charts, graphs, and tables, which are used to represent data in a way that is easy to understand and interpret. Dashboards can be customized to suit the specific needs of an organization, with different types of data being displayed depending on the business process or decision being supported. The overall goal of a dashboard is to help users make informed and effective decisions by providing them with the information they need in a concise, easy-to-understand format.
At times the BI dashboards are often confused to performance scorecards, and there is a considerable difference between the two. Performance scorecards display the progress over time towards a specific business goal while BI dashboards emulate the car dashboards functionalities thus indicates the status at a particular time point.
Though the designs of the two are increasingly converging hence some of the dashboards, have started incorporating the ability to track progress towards business goals as a software feature. When dashboards are efficiently utilized, they can help in making informed decisions, which will impact the business performance immensely.
You many want to review the Top Open Source, Free and Top Dashboard Software
What are the types of Dashboard Software?
Dashboards need to start with an audience in mind, as people look at the world from the perspective of their job role. In order to fully connect with them, the data need to be presented in an appropriate dashboard type in their context so that it translate into meaningful information in a way that fits their needs, responsibility and ability.
Dashboards can be broadly classified as Operational Dashboards, Strategic Dashboards and Analytical Dashboards.
- Operational Dashboards: Operational dashboard track the current situation based on the metrics and Key Performance Indicators and tell you what is happening now.
- Strategic Dashboards : Strategic Dashboards track the strategic goals based on the metrics and Key Performance Indicators and tell you what is happening against enterprise-wide strategic goals.
- Analytical Dashboards: Analytical Dashboards track the trends and patterns based on the metrics and Key Performance Indicators process in your historical data to identify trends and patterns.
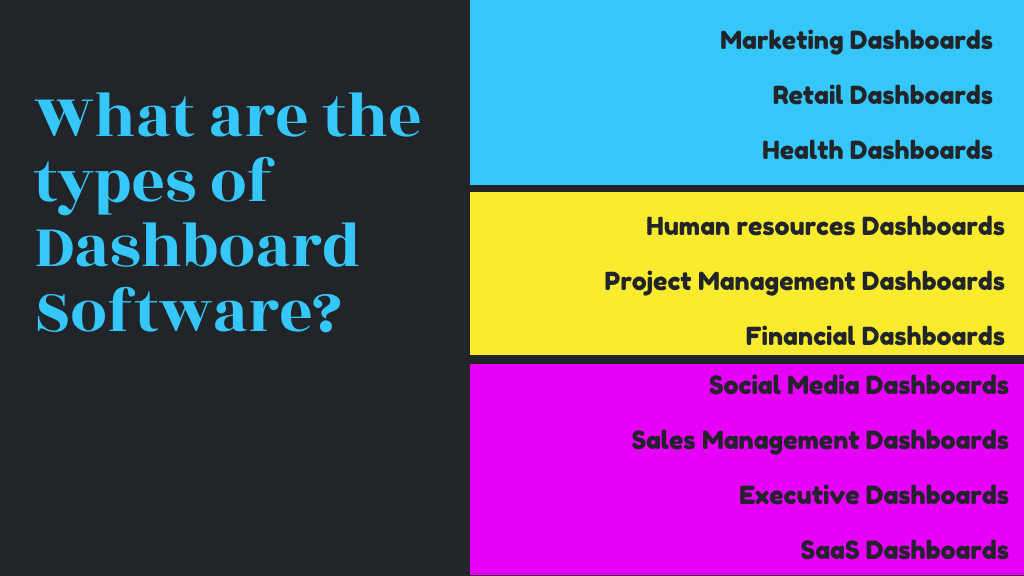
What are the types of Dashboard Software
- Marketing Dashboards
Marketing occupies a huge role in any business; it acts as a platform for an introduction of a business product or service to potential buyers. The modern marketers combine all the marketing qualities by carefully measuring the outcomes of their marketing campaigns to see how good they were able to connect with their audience. Now with marketing dashboards, it’s able to demonstrate the analytics, quantifiable measures and KPIs marketers to be able to improve their performance. Some of marketing dashboard examples include:
- Digital Marketing Dashboards: Tracks and show metrics across different channels, eg, emails, websites, social media, lead generations
- Market performance Dashboards: Helps in campaign spend and making decisions regarding marketing through a comprehensive conversational funnel.
- Retail Dashboards
BI tools are designed in a way to meet retailer’s needs. The retail dashboard enables users to easily and quickly interpret and understand large data sets. With that, the teams can make recommendations relevant to the business which will work or not work as the retail market continues to grow. Examples of retail dashboards include:
- Retailer Analysis: It gives dynamic information into retailer data store levels and tracking by time over the location of the financial performance.
- Customer Acquisition: It is used by most online retailers as it helps them identify efficient channels to track new customer traffic, conversion rates, and revenue. It enables optimization of marketing activities.
- eCommerce KPI: It tracks customer online behavior patterns, for a specific location and tracks where the revenue comes from.
- Pricing and Supplies: It shows how an increase or decrease in product price affects sales and supply chain performance for product categories.
- Health Dashboards
One of the most important priorities of majority healthcare providers is improving the quality of patient care. Healthcare administrators and providers need to achieve compliance, reduce ER wait time, adjust services, facilitate critical procedures and manage cost. Examples of healthcare dashboards include:
- Pharma Sales Force Analysis: It performs sale force analysis including calls and number of reps visits on a monthly or yearly basis and can also be filtered by location and reps.
- Private Practice: It’s designed for a private practice whose agenda is to optimize patient’s care and resources allocations. Features it includes are patient satisfaction and time spent per consultation.
- Pharma Sales: It used to compare target with revenue and customer orders sales performance with delivered quantities. Filtered by the customer, location, and products available.
- Human resources Dashboards
These dashboards enable smooth monitoring of employee satisfaction and the recruitment process. It also keeps the executives informed on critical metrics on available positions, fresh employee’s performance and employee net promoter score. It works well on TV displays. Examples of Human resources dashboards include:
- Candidate Interviews: The dashboard tracks open positions within a segmentation and the recruitment activity on a monthly basis.
- Survey Results: It can incorporate all your survey results into the dashboard. It captures all the results from another survey tool per category or per question.
- Project Management Dashboards
This dashboard provides an overview of all project workings. It shows at a glance project Key Performance Indicators (KPIs) and acts as a progress report. It offers views on budget, time, workload, health, issues, cost, risks and changes in a project. All those areas in a single dashboard, populated in the form of graphs which makes it easier for the project managers to understand the lifecycle of the company. Examples of project management dashboards include:
- Project Status: This dashboard enables project managers to keep track of important factors such as completed projects, phases cost and time for project success.
- Productivity KPIs: The dashboard shows team management and time tracking overview on a project. The data can be filtered by team, team members, and client project
- Financial Dashboards
This dashboard provides an instant view of financial KPIs in an organization. It enables finance to track profits, sales and monitor expenses in real time. It also shows areas in the department where it requires quick attention. An efficient implemented financial dashboard can help a business save a lot of money and time. Examples of financial dashboards include:
- Financial Controlling: With this dashboard, the user can access all the important business unit indicators: debt ratios, gross and net profits and available assets. It’s a sum up of your financial status.
- Financial Performance: It displays financial KPIs in the form of payment type, cash or benchmark position for the current year. It shows a comparison of payments, cash or electronic payments and can filter by subsidiary and location.
- Monthly Financials: It helps business track budgets against actual sales, overall profitability and expenses by category. It also includes cash flow projection.
- Social Media Dashboards
To run a successful social media campaign, frame your campaign data within the context of your brand and measure the impact of each interaction. Examples of social media dashboards include:
- Twitter Analytics Dashboard: This dashboard compares web performance you your twitter performance and analyses to find the effect of your marketing efforts.
- Facebook Ads Dashboard: This dashboard helps the business users to monitor all Facebook Ads campaigns and enables you to answer questions smoothly which guide social media marketing strategies.
- Social Media Monitoring Dashboard: Social media marketers ought to keep track of all the following on all social media platforms. This dashboard allows tracking of recent posts, comments, likes, subscribers, and quick view to the followers on all platforms.
- Sales Management Dashboards
These dashboards are used to track the overall sales of product, region and salesperson performance. With these dashboards the business user can track issues and resolve them, drive progress and enhance employee accountability. Examples of sales management dashboards include:
- Sales Dashboard: This dashboard enables business users to track all the sales, customers and sales people’s reports in a given timeline.
- Regional Dashboard: It’s a drill down dashboard that shows sales in a specific region, which has been selected by the business user. E.g., if the user selects the US, the dashboard will display all the sales detail of that specified region at a specified time.
- Executive Dashboards
Most of these business dashboards are compelling tools for business executives because they enable them to break down complex information into small chunks which are easily understandable. Executive dashboards example is supposed to give guidelines on which KPIs to be included in the executive dashboard.
- KPI Dashboard: This dashboard tells the story of the subject matter in a business, it may consist of safety, quality, and strategies.
- Executive Reporting Dashboard: It consolidates overall departmental performance so that the executives can be in touch with changes and opportunities in a company. The metrics in executive reporting dashboards easily visualize the data to make it easy to understand the past, present, and future of the project.
- Status Dashboard: This dashboard provides an overall overview of departmental performance in a company. It gives a quick yet accurate assessment of department performance which it is ideal for the executives.
- SaaS Dashboards
In a very competitive marketplace software as a service (SaaS) is asked to growth. SaaS businesses should focus on improving customer retention, lifetime customer value, and monthly recurring revenues. SaaS dashboards can monitor all business process; support, finances, sales, and marketing in business. Examples of SaaS dashboards include:
- SaaS Growth Dashboards: These are the ideal dashboards for any SaaS companies as a monitoring tool that combine your MRR data and all your accounts enabling you to understand your business from past, present and future scales.
- SaaS Metric Dashboards: It shows how new business or startups can track growth and performance in their business.
- SaaS Executive Dashboards: It’s a dashboard that expands to give all departmental business metrics from user experience support, sales, marketing, product, and finance.
You many want to review the Top Open Source, Free and Top Dashboard Software
How to Select the Right Dashboard Type for Your Business
Selecting the right dashboard type for your business requires careful consideration of several factors, including the type of data you need to display, the level of detail required, the frequency of updates, and the intended audience. For example, a high-level dashboard with simple visualizations and a limited amount of data may be suitable for senior management, while a more detailed dashboard with drill-down capabilities may be better suited for operational teams. It's important to consider the types of visualizations that will be most effective for representing the data, such as bar charts, line graphs, or pie charts. Another important consideration is the frequency of updates - a real-time dashboard may be necessary for certain processes, while a weekly or monthly dashboard may be sufficient for others. Ultimately, the goal is to select a dashboard type that will meet the specific needs of your business, help you achieve your goals, and provide value to your users.
Dashboards are attractive features of potential to the user of business intelligence tool. Dashboards don’t have magical properties but rather enable corporate to make effective decisions regarding their businesses if implemented in the right way. Here are some of the best tips to ensure you chose the right dashboard:
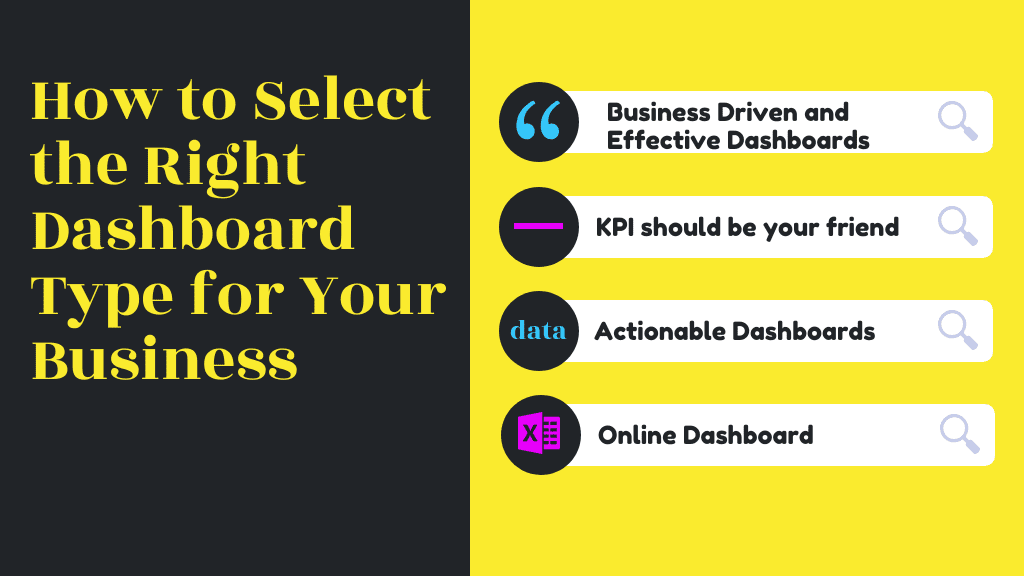
How to Select the Right Dashboard Type for Your Business
- Business Driven and Effective Dashboards
The question you should ask yourself before selecting a dashboard is what goals are you trying to attain through that dashboard? Which specific process are you trying to make efficient? What information are you trying to make readily available and why? You should ensure you’re able to answer the questions correctly and specific to be able to select the right dashboard to enable you to achieve your business strategies.
- KPI should be your friend
The business user needs to understand what the key performance indicators of the company are and indicate if they are performing well or need corrective measures. With that, you can identify the specific dashboard that will tackle the identified issues.
- Actionable Dashboards
A dashboard is useless if it can determine a problem and unable to give you actionable chance to do something on the subject. When selecting a dashboard business user should be keen on choosing a dashboard that can identify an issue, analyze it effectively and offer a solution on handling the challenge without having to leave the application.
- Online Dashboard
With technology and internet taking over in the BI world, it’s essential for a business to have dashboards online. This implies being in a position to access your dashboard over the internet. Having an online dashboard can enable you access and share them anywhere at any time so when selecting one user should ensure this feature is incorporated into their dashboard.
Here are the trending and the top rated Dashboard Software for you to consider in your selection process:


You may also like to read, Top Business Intelligence companies , Top Open Source and Free Business Intelligence Software , Cloud – SaaS – OnDemand Business Intelligence Solutions , Top Free Extract, Transform, and Load, ETL Software , Freemium Cloud Business Intelligence Solutions , Top Embedded Analytics Business Intelligence Software , Top Dashboard Software , Top Enterprise Performance Management Software ,Top Data Visualization Software,Top Business Intelligence Tools,Top Supply Chain Analytics Software,Top Conjoint Analysis Software,Top Unified Modeling Language (UML) Tools ,Top Mobile Business Intelligence Software ,Top Balanced Scorecard Software , Top Advertising Analytics Software and Top Business Process Management Software .
What is the purpose of a Dashboard?
A dashboard is a visualization tool for data, which displays and analyzes key performance indicators (KPIs) and quantifiable measures for a specific process, department or a business as a whole. With just one glance, dashboards give businesses users multiple of insights that are important to their business. A dashboard can as well be used to define metrics, predominantly identify problems and set performance goals for the business.
What are the types of Dashboard Software?
Dashboards need to start with an audience in mind, as people look at the world from the perspective of their job role. Dashboards can be broadly classified as Operational Dashboards, Strategic Dashboards and Analytical Dashboards.


By clicking Sign In with Social Media, you agree to let PAT RESEARCH store, use and/or disclose your Social Media profile and email address in accordance with the PAT RESEARCH Privacy Policy and agree to the Terms of Use.