
How to Select the Best Visual Analytics Software for Your Business

We are in a world where a significant amount of data is being consumed daily, and more is generated as the days go by. In the past decade, there has been a substantial improvement in data creation, data collection, and advancement of the data storage devices which has been influenced the way we deal with information. Lots of time data is captured and stored to use later without filtering and refining it.
Virtually in every business, political or personal activity, the industry there is a generation of a vast amount of data and what’s worst the possibility of getting and storing the data is rising at a fast rate compared to our ability to make decisions. However, the data collected is raw; thus it has no value in itself until you can extract the information in it.
You may like to read: Top Best Practices in Data Visualization, Top Data Visualization Software and Free, Open Source and Top Chart Builder Software.
What is Visual Analytics?
Visual analytics is the science of analytical reasoning which is made possible by interactive visual interfaces. It can tackle specific issues whose complexity, size and need for a closely paired machine and human analysis which make them hard to deal with. With visual analytics, it enhances the technology development in analytical interaction, data transformation, reasoning, technology transition, analytic reporting and the representations for visualization and computation.
The beauty of visual analytics is that it brings technical and scientific communities together from different fields such as information visualization, interactive design, computer science, social sciences, cognitive and perceptual sciences. Working in each of the areas leads to focusing on different practical and theoretical aspects of users solving real-world issues with the help of Information technology efficiently and effectively.
Visual analytics enables tools with common, contemporary techniques and visual depiction to enhance human-information discourse. The design of techniques and tolls is based on perceptual, design and cognitive concepts.
The analytical thinking gives reasoning framework, which one can create tactical as well as strategic visual analytics technologies risky analysis, prevention measures and solutions on handling them. The analyst’s task is centralized to analytical reasoning in making human judgments to conclude from both assumptions and evidence.
In other words, visual analytics includes both interactive visualization and automated techniques of analysis for productive reasoning, understanding, and decision making on complex and large datasets. The objectives of visual analytics are the development of tools and techniques to enable individuals to:
- Uncover the unexpected and identify the expected.
- Provide assessment that is logical, timely and understandable.
- Communicate the assessments adequately for operation.
- Derive and synthesize insights from extensive, dynamic, complicated and contradicting data.
By integrating the above, there is available opportunity to form a productive and one of a kind field of visual analytics.
You may like to read: Top Best Practices in Data Visualization, Top Data Visualization Software and Free, Open Source and Top Chart Builder Software.
What are the processes for Visual Analytics?
Visual analytics primary focus is to obtain insight into complex and large datasets. The visual analytics process model is a crucial concept that integrates visual analysis methods and also human interaction. Below is the process model workflow:
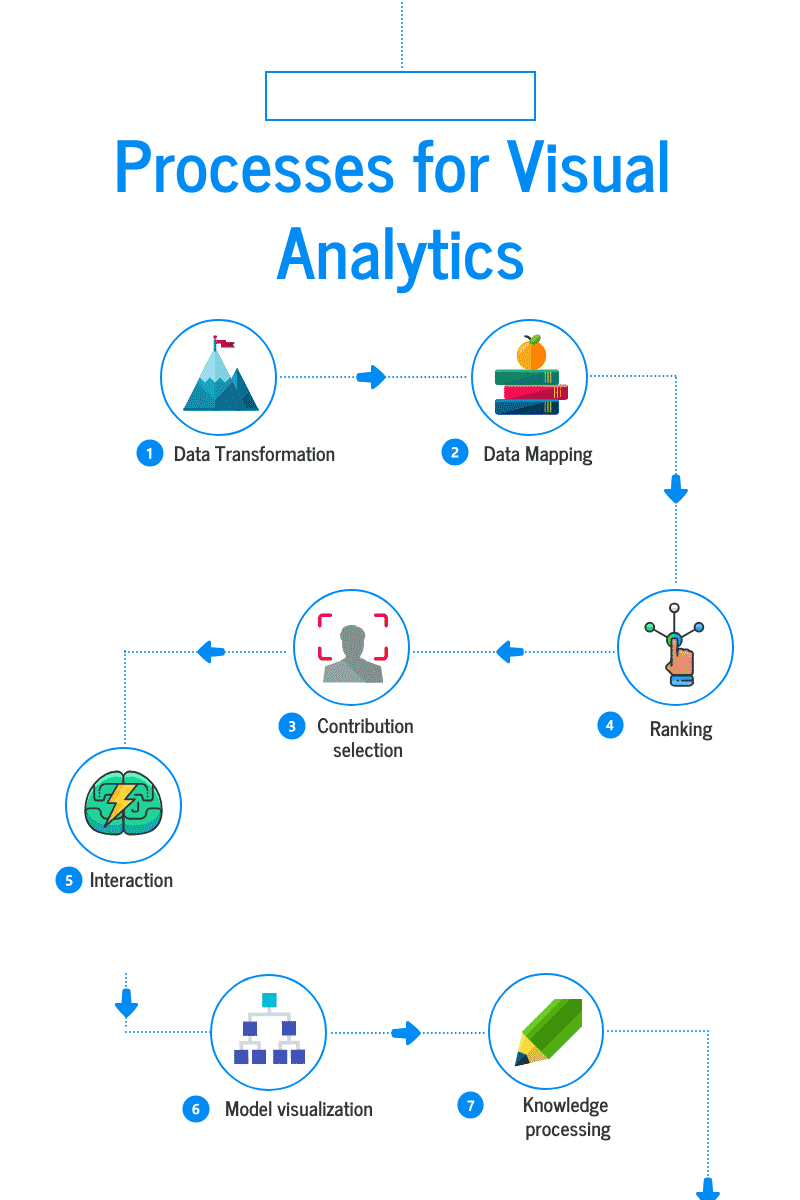
What are the processes for Visual Analytics
- Data Transformation
Also known as bin counting. The analyst starts by first getting the overview which includes evaluation and exploration of essential regions as provided in the map and areas with an adequately high number of contributions. The analyst then initiates the application-internal formation of the heat map. A standard framework is registered to the map and several contributions by counting each computed cell that spatially corresponds which results to an internal representation.
- Data Mapping
Also referred as heat map visualization. In the application, there is a color code mapped on each cell’s value to the map, e.g., through using of greyscale. It leads to visual conversion of the important regions.
- Interaction
It is known as heat map exploration. Contributions are likely to relate to each other in the same spatial region. It’s good to process them together although it might be disputable. Potential regions, on the other hand, are the best place to start from the contribution processing because from the contributor point of view that’s the main focus of interest. The planner uses zooming and panning techniques to explore visual heat map representation to focus the attention on other regions. With zooming each cell can reveal the individual contribution of the given location.
- Contribution selection
When the planner wants to view the actual content, it can be viewed by selecting a contribution. Once the planner is done with analyzing the content in the related contribution one after the other because this makes the analyzing process smooth. The system can perform a ranking process where it can rank the similar contributions taking into account a couple of geographic closeness to rank in decreasing order of similarity.
- Ranking
It is also known as model building. Similar to search engine ranking model the contribution which is selected acts as a query for developing a ranking model. The objective is to sort all retrieved contributions according to similarity to the queried contribution.
- Model visualization
It is also known as score encoding. The ranking needs to be visualized to enable examination of the ranking model. Then map color to each of the archived contribution scores to perform map visualization. However, just like internet search engines, the ranking order can also be visualized as s descending list.
- Knowledge processing
It is established on visualization ranking model, on concrete software implementation there are many possibilities for continual actions arise. A case of development of a concept plan where aggregated ideas appear as described in goals of use case’s which states that aggregation of contribution is a crucial step. During clustering of an idea, the first candidates to take into consideration is near duplicates. Alternative plans which might later be presented are developed through guiding of controversial contributions. So the contributions left to analyze the systems will support its reduction and direct concept development transfer. Group of contributions ranked nearer should be selected by the planner and add notes for future reporting. This can change individual contribution processing state that’s according to the planner.
You may like to read: Top Best Practices in Data Visualization, Top Data Visualization Software and Free, Open Source and Top Chart Builder Software.
How to Select a Visual Analytics Application?
The visual analytics applications have several elements that define it. There are many considerations to examine when making a decision or choice on a standard of visual analytics. A good example will be for the business environment if you are going to use a visual analytics application you should take into consideration the infrastructure and the technicality.
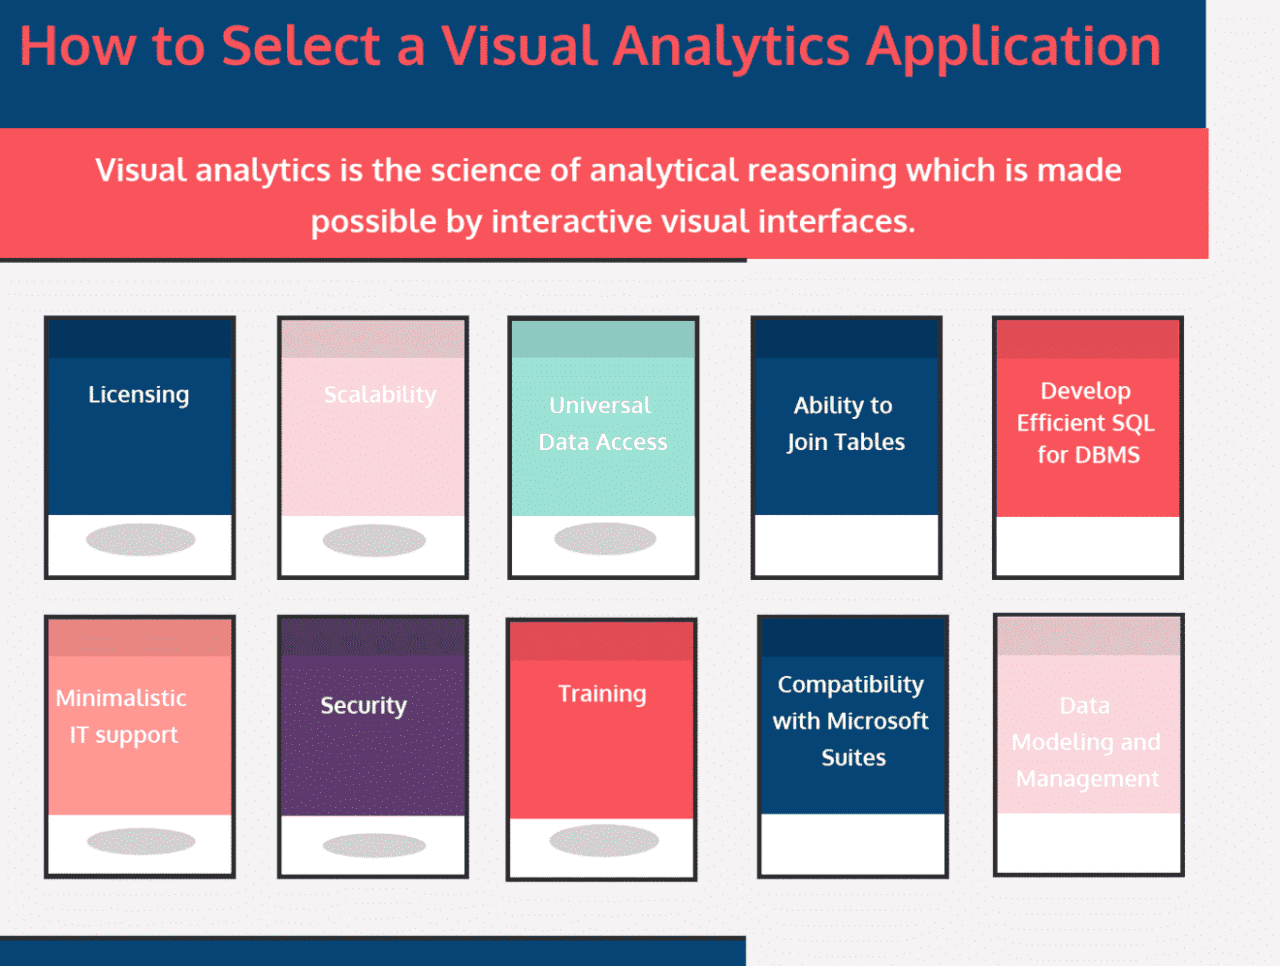
How to Select a Visual Analytics Application
- Licensing
You should ensure that the licensing models are flexible and they are based on the needs of the users with minimal configurations on all licensing even if you buy 1, 100, 100 licenses.
- Scalability
The software can support interactive visualization of millions or billions of records of data in real-time capabilities. The application should be able to provide comprehensive performance and being able to handle massive amounts of data quick and effectively.
- Universal Data Access
Data can come from different directions. So you should ensure that the application can connect to any source virtually, either from text files or data warehouses to excel format. The visual analytics application should be able to connect to all formats including flat files, relational databases, and OLAP data cubes and the connection should be easily made for new data sources.
- Ability to Join Tables
Visual analytics application should have table joining capabilities. Users should be capable of joining the tables easily in techniques that are suitable and adequately designed joins.
- Develop Efficient SQL for DBMS
Visual analytics applications should generate reports fast. Users should be able to create results by having an option of acquiring, modify and run SQL from the reports generated. Other than real data views and table the users should be capable of connecting to the SQL statements.
- Minimalistic IT support
Having a good visual analytics application there is no need for IT support thus freeing them from such small tasks. The application will install smoothly, provide easy user manuals and train on demand and set up the average users without any help in matters of minutes.
- Security
Before selecting a visual analytics application, you should consider if the application has full security model which will support combination within existing permission methods. Visual analytics should be able to integrate with alternative security systems optional a good example of alternative methods is Active Directory.
- Training
In any process or implementation or software introduction to a company, users can’t get started with it without being trained. Before selecting the business should consider, how much training is needed? Many applications are developed with a minimalistic user interface which is easy to operate even to novice users. But training should be considered on other features because once users become advance on visual analytics skills, there is a need for sophisticated training based on their needs and time schedules.
- Compatibility with Microsoft Suites
In almost all desktops of different business users, there is one or several MS suites. So before selecting a visual analytics application, you should consider if the application provides gateways in and out of MS Office, can data be accessed natively from office, can the application output tables, images, cross-tabs and data lists directly and easily to Office.
- Data Modeling and Management
When selecting data visualization application, the user should consider if they can share the whole data model used to develop visualization –along with groups and individual calculations. Measurements and dimensions that have data integrity and consistently defined, users should be able to rely on them. The application should be able to allow users replicate variables, standardize dimensions, field names changing and variable type modification without the help of a developer. This is important because it reduces a burden on IT and ensures users have the analytical power.
You may like to read: Top Best Practices in Data Visualization, Top Data Visualization Software and Free, Open Source and Top Chart Builder Software.
What is Visual Analytics?
Visual analytics is the science of analytical reasoning which is made possible by interactive visual interfaces. It can tackle specific issues whose complexity, size and need for a closely paired machine and human analysis which make them hard to deal with. With visual analytics, it enhances the technology development in analytical interaction, data transformation, reasoning, technology transition, analytic reporting and the representations for visualization and computation.
What are the processes for Visual Analytics?
The visual analytics process model is a crucial concept that integrates visual analysis methods and also human interaction. The processes for Visual Analytics includes Data Transformation, Data Mapping, Interaction, Contribution selection, Ranking. Model visualization and Knowledge processing.
How to Select a Visual Analytics Application?
The visual analytics applications have several elements that define it and selection depends on Licensing, Scalability, Universal Data Access, Ability to Join Tables, Develop Efficient SQL for DBMS, Minimalistic IT support, Security, Training, Compatibility with Microsoft Suites and Data Modeling and Management.


By clicking Sign In with Social Media, you agree to let PAT RESEARCH store, use and/or disclose your Social Media profile and email address in accordance with the PAT RESEARCH Privacy Policy and agree to the Terms of Use.