Sign in to see all reviews and comparisons. It's Free!
By clicking Sign In with Social Media, you agree to let PAT RESEARCH store, use and/or disclose your Social Media profile and email address in accordance with the PAT RESEARCH Privacy Policy and agree to the Terms of Use.
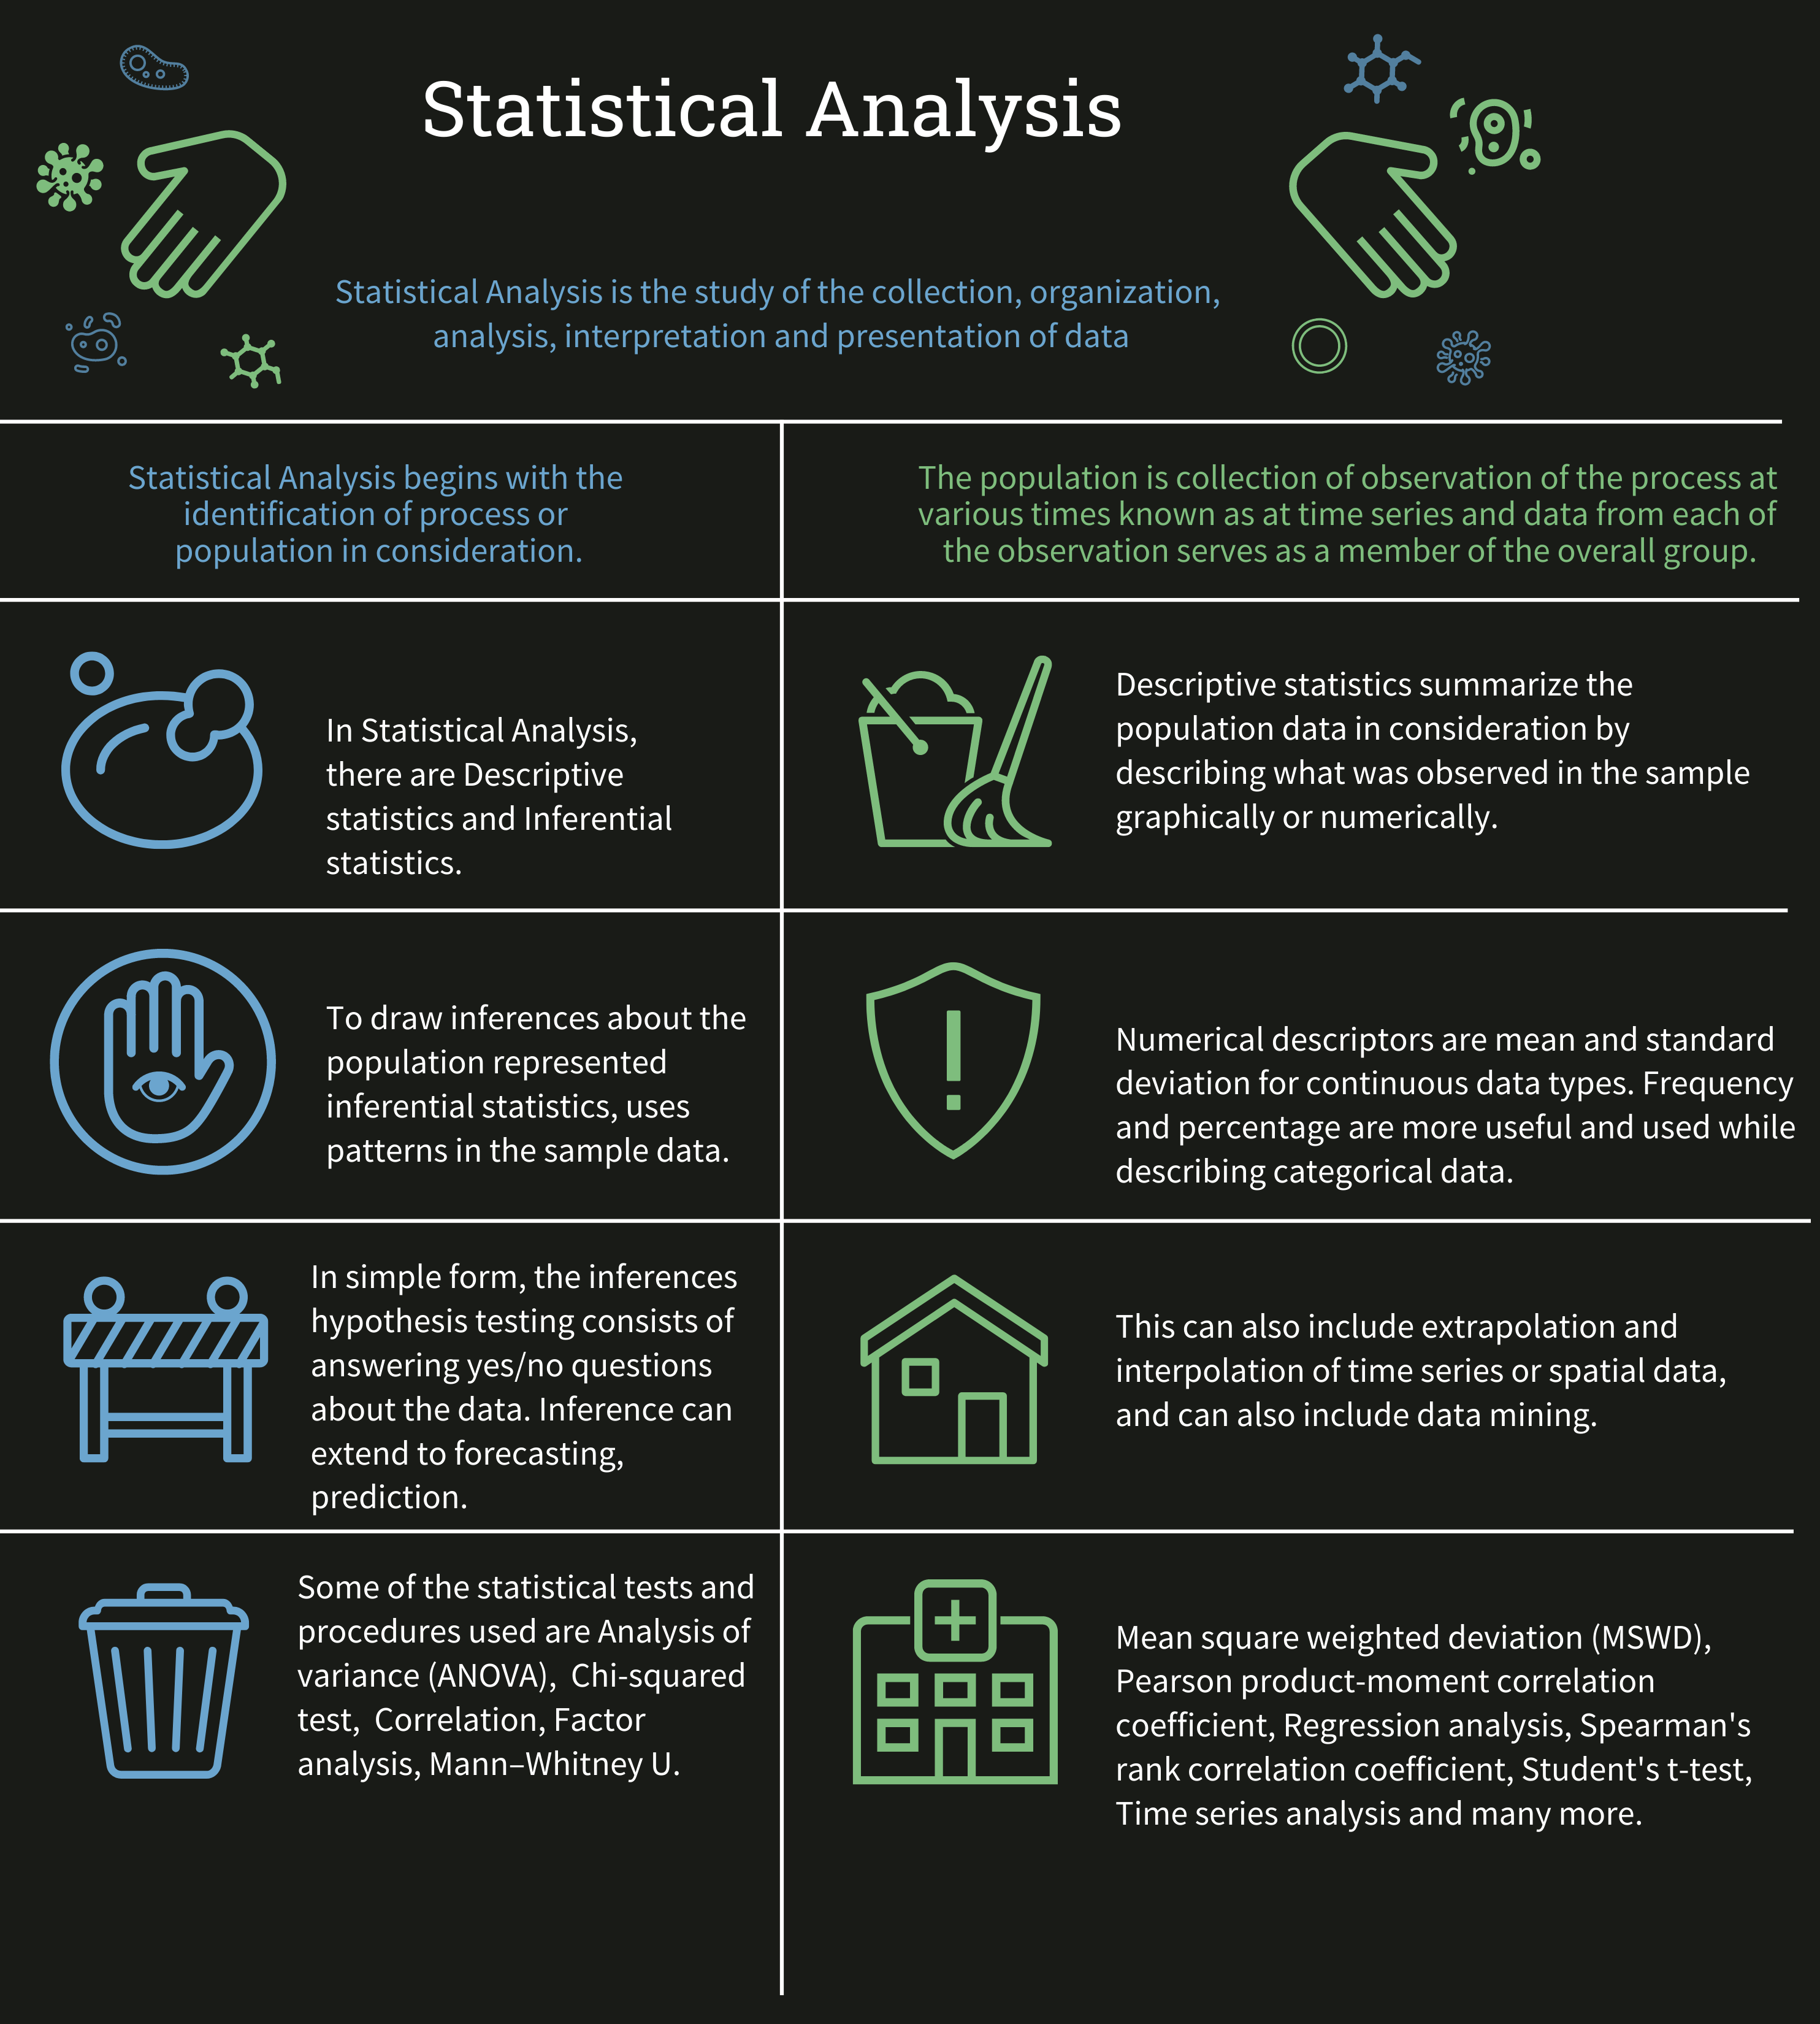
Statistical Analysis is the study of the collection, organization, analysis, interpretation and presentation of data. Statistical Analysis begins with the identification of process or population in consideration. The population is collection of observation of the process at various times known as at time series and data from each of the observation serves as a member of the overall group.
In Statistical Analysis, there are Descriptive statistics and Inferential statistics. Descriptive statistics summarize the population data in consideration by describing what was observed in the sample graphically or numerically. Numerical descriptors are mean and standard deviation for continuous data types. Frequency and percentage are more useful and used while describing categorical data.
To draw inferences about the population represented inferential statistics, uses patterns in the sample data. This also takes in to consideration of randomness. In simple form, the inferences hypothesis testing consists of answering yes/no questions about the data. Inference can extend to forecasting, prediction. This can also include extrapolation and interpolation of time series or spatial data, and can also include data mining.
• Analysis of variance (ANOVA): ANOVA models are used to analyze the differences between group means and the variation among and between the groups.
• Chi-squared test: This is a hypothesis in where when the null hypothesis is true when the sampling distribution of the test statistic is a chi-squared distribution.
• Correlation: Correlation means the dependence between the statistical relationship between two random variables or two sets of data.
• Factor analysis : This describe the variability among observed and correlated variables with reference to factors which are unobserved variables.
• Mann–Whitney U : This a hypothesis that a particular population tends to have larger values than the other.
• Mean square weighted deviation (MSWD) : Measures of goodness of fit.
• Pearson product-moment correlation coefficient : This is a measure of the degree of linear dependence between two variables.
• Regression analysis : Estimating the relationships among variables.
• Spearman's rank correlation coefficient : Measure of statistical dependence between two variables.
• Student's t-test : This is used to determine if two sets of data are significantly different from each other.
• Time series analysis : This is a sequence of data points, measured at successive points in time.
• k-nearest neighbor algorithm (k-NN)is a non-parametric method for classification and regression, which predicts the objects values or class memberships based on the k closest training examples in the feature space.
• Majority classifier takes non anomalous data and incorporates it within its calculations. This ensures that the results produced by the predictive modeling system are as valid as possible.
• Group method of data handling algorithms for computer based mathematical modeling of multi-parametric datasets features fully automatic structural and parametric optimization of models. GMDH is used in fields such as data mining, knowledge discovery, prediction, complex systems modeling, optimization and pattern recognition.
• Logistic regression is a technique in which unknown values of a discrete variable are predicted based on known values of one or more continuous and/or discrete variables.
• Uplift Modeling is a technique for modeling the change in probability caused by an action.
• Naive Bayes classifier is a simple probabilistic classifier based on applying Bayes theorem with strong naive independence assumptions.
• Support vector machines re supervised learning models with associated learning algorithms that analyze data and recognize patterns, are used for classification and regression analysis.
Statistical Analysis is the study of the collection, organization, analysis, interpretation and presentation of data. Statistical Analysis begins with the identification of process or population in consideration. The population is collection of observation of the process at various times known as at time series and data from each of the observation serves as a member of the overall group.
What are Statistical Tests and Procedures?
Some of the statistical tests and procedures used in predictive analytics are: Analysis of variance (ANOVA), Chi-squared test, Correlation, Factor analysis, Mann–Whitney U, Mean square weighted deviation (MSWD), Pearson product-moment correlation coefficient, Regression analysis, Spearman's rank correlation coefficient, Student's t-test, Time series analysis and many more


ADDITIONAL INFORMATION
I’m so interested I wish you the vary best.good luck