
32 Cloud Analytics Software

Cloud Analytics is a term used to represent the analysis using cloud computing. Cloud Analytics uses a range of analytical tools and techniques to help companies extract information from massive data and present it in a way to be made accessible via cloud through a web browser.
Cloud or SaaS or OnDemand Business Intelligence Software follows a delivery model in which applications are typically deployed outside of an organisations firewall and at a hosted location. The business intelligence technology is sold by vendors as a subscription service or as a pay as you go service. This is different from the traditional Software licensing model with annual maintenance fees.
Cloud or SaaS or OnDemand Business Intelligence Software allow business to use Business Intelligence tools without having to install, operate and maintain them on premise. This enables the business users to concentrate on creating BI reports and analytic queries rather than supporting their installation.Such business intelligence Software are known as SaaS, which is Software as a Service Business Intelligence, Cloud Business Intelligence, OnDemand Business Intelligence.
What are the Best Cloud Analytics Software: Sisense, Sisense for Cloud Data Teams, Microsoft Power BI Pro, IBM Cognos Analytics, ThoughtSpot, GoodData, Amazon QuickSight, Datapine Business Intelligence, MicroStrategy, Pyramid Analytics, Birst BI, WebFOCUS Platform, SAP BusinessObjects BI, Domo, Oracle Business Intelligence, Tableau Online, Qlik Sense Enterprise, Phocas BI Software, Dundas BI, Yellowfin, BIME Analytics, Looker, Izenda, InetSoft Style Intelligence, TARGIT Decision Suite, TIBCO Spotfire Cloud, Logi Analytics, Clear Analytics, Socrata Open Performance, Wunderdata, OQLIS, Saasabi Pro are some of the example of the best Cloud – SaaS – OnDemand Business Intelligence Software.
What are Cloud Analytics Software?
Cloud Business Intelligence offers a service model where applications are hosted on a virtual network. The Business Intelligence Software is available as a service, where individual users log in to a secure URL to retrieve information, perform analytics, and generate reports via the web.
Cloud Business Intelligence allow users to take benefit from all of these technologies, without the need for deep knowledge about or expertise with each one of them. The cloud aims to cut costs, and helps the users focus on their core business instead of being impeded by IT obstacles.
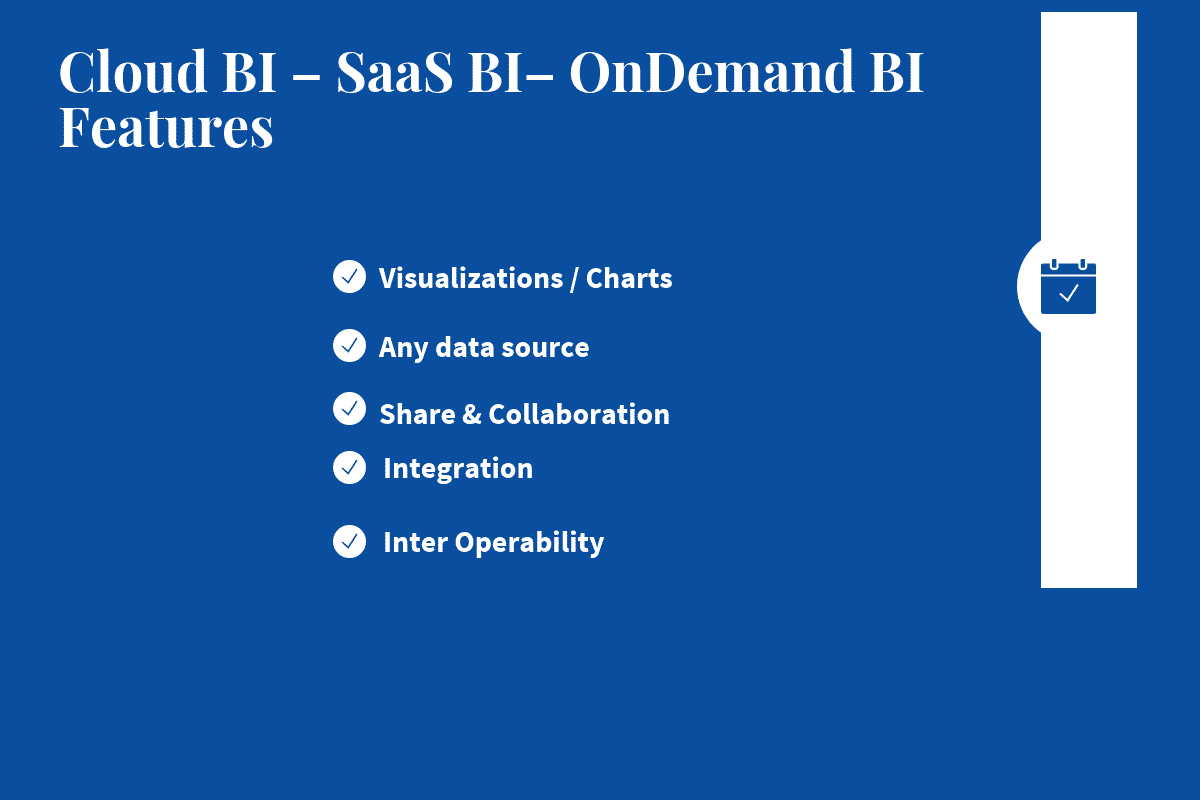
Cloud BI – SaaS BI– OnDemand BI Business Intelligence Software Features
Some of the features include:
- Visualizations / Charts: Features for data visualization and numerous charts with sorting, dice and slice capability.
- Any data source: Ability to integrate with any data sources.
- Share & Collaboration: Features to share and collaborate within and outside the organization
- Integration: Tools to integrate with other BI Software and services.
- Inter Operability: Available in any device- desktop, tablets, mobile and in offline mode.
You may like to read How to Select the Best Cloud Business Intelligence Software for Your Business
Top Cloud Analytics Software


Sisense
Sisense simplifies business analytics for complex data. Powered by In-Chip and Single Stack technologies Sisense delivers unmatched performance, agility and value, eliminating much of the costly data preparation traditionally needed with business analytics tools and providing a single, complete tool to analyze and visualize large, disparate data sets without IT resources. Sisense’s expertise in complex data includes both large data sets and data derived from multiple, disparate sources. Sisense leverages In-Chip analytics to dramatically improve business users’ access to advanced analytics on low-cost, commodity machines without the need for special data warehouse tools or dedicated IT staff. One-click formulas offer…
•Join data from multiple sources
•Drag & drop joining of multiple data sources
•Build interactive dashboards with no tech skills
•Share interactive dashboards
•Provide users the freedom to query data in real-time
Contact for Pricing
Sisense for Cloud Data Teams
Sisense for Cloud Data Teams formerly Periscope Data is an end-to-end BI and analytics solution that lets you quickly connect your data, then analyze, visualize and share insights. Periscope Data can securely connect and join data from any source, creating a single source of truth for your organization. Perform BI reporting and advanced analytics operations all from one integrated platform. Communicate insights more effectively by selecting from Periscope Data’s wide range of visualization options (including standard charts, statistical plots, maps and more) and instantly share real-time insights via direct linking, email or Slack. Periscope Data is a data analysis tool that unifies business data across multiple…
•One Tool For All Your Data Needs
•Enable data experts to answer more complex questions, quickly.
•SQL Editor Built By Experts, For Experts
•Advanced Analytics With Python And R
•Intuitive Drag-and-Drop Interface
Contact for Pricing
Microsoft Power BI Pro
Microsoft Power BI, is a cloud based, software as a service, self-service business intelligence solution for non technical business users. With just any browser or a Power BI mobile app, customers can keep a pulse on their business via live operational dashboards. They can deeply explore their business data, through interactive visual reports, and enrich it with additional data sources. The first version of Power BI was launched last February and since then customers have used it to gain powerful insights, helping them become more productive and competitive. Power BI let you connect to your data in minutes, with built…
• Noisy neighbors isolation
• Huge dataset storage and no user quotas
• Higher dataset refresh rates
• Large datasets
•Power BI Pro-$9.99- Monthly price per user
•Power BI Premium-$4,995 - Monthly price per dedicated cloud compute and storage resource
IBM Cognos Analytics
IBM Cognos Analytics offers smarter, self-service capabilities so you can quickly and confidently identify and act on insight. The engaging experience empowers business users to create and or personalize dashboards and reports on their own while providing IT with a proven and scalable solution that is available on premises or on the cloud. Cognos Analytics is ready when you are with a unified experience that works the same on web or mobile devices, enabling you to quickly find, analyze, create and share insight. IBM Cognos Analytics introduces smarter self-service that guides you in generating insights from data for impressive and…
• Dashboarding
• Storytelling
• Reporting
• Support for Planning Analytics
• Data server
• Contextualized smart search
• Trial - Starting at $1,990.00 USD per month
• IBM Cognos Analytics Workgroup Edition on Cloud - Starting at $1,990.00 USD per month
• Standard - Starting at $10,100.00 USD per month
• Enterprise - Starting at $133,000.00 USD per month
ThoughtSpot
ThoughtSpot offers search-driven analytics for enterprises. The company allows users to search and analyze data, ask questions, get instant charts, analyze company data, build reports, share data, and offers dashboards. It serves communication, retail, financial service, healthcare and life science, and manufacturing sectors. ThoughtSpot's allows for non-technical individuals to conduct a self-service data analysis search. ThoughtSpot's relational search engine can analyze information from any data source, including point of sale data, data warehouses, and social media sites. Search-Driven Analytics allows analyzing data and creating reports and dashboards in seconds. There is no need for SQL expertise or lengthy training sessions…
•Guided Search Experience
•On-the-Fly Calculations
•100% Accuracy
•Security
•Unlimited Data Scale
•Easy to manage
•Unlimited Users
From $75,000
GoodData
The GoodData platform includes advanced distribution and product lifecycle management features to automate the process of maintaining one-to-many cloud deployments. GoodData provides a highly engaging guided analytic exploration experience that drives actionable insights by teaching users best practice techniques through recommendations inside the interface. GoodData’s dashboards are responsive, mobile optimized, and include built-in alert, email and collaboration features to promote sharing across the organization GoodData provides groundbreaking BI for data monetization to enterprises, independent software vendors, and system integrators who seek to unlock the value of data for their business networks with engaging, one-to-many analytics. The intelligent analytics distribution platform…
• Deliver Packaged Analytics
• Accelerate Time-to-Market without Compromising Functionality
• Enable Hundreds of Thousands of Business Users to Operate on Massive Datasets
• Boost Security and Compliance
• Seamlessly Embed Analytics In-Context
• Deliver Powerful Analytics
• Technical Capabilities
• Free version
•Growth- 200 per year per customer
•Enterprise- Contact for Pricing
Amazon QuickSight
Amazon QuickSight is a cloud-powered business intelligence for 1/10th the cost of traditional BI solutions. It is used for building visualizations, performing ad-hoc analysis and quickly get business insights from their data. Amazon QuickSight uses a new, Super-fast, Parallel, In-memory Calculation Engine (“SPICE”) to perform advanced calculations and render visualizations rapidly.Easily connect Amazon QuickSight to AWS data services, including Amazon Redshift, Amazon RDS, Amazon Aurora, Amazon EMR, Amazon DynamoDB, Amazon S3, and Amazon Kinesis; upload CSV, TSV, and spreadsheet files; or connect to third-party data sources such as Salesforce. Amazon QuickSight’s easy to use features automatically infers data types and…
• Connect to Local Excel Files
• Create Unlimited Dashboards
• Unlimited Distribution of HTML Dashboard Files
• Includes Support and Updates
• Use Multiple Data Sets in One Dashboard
• Point–and–click To Add Custom Columns
• Authors $18 /user/mo. with annual subscription
• Readers $0.30 up to $5
Datapine Business Intelligence
Datapine provides a scalable SaaS, data analysis tool that gives customers fast and easy access to their business intelligence data without the need for any SQL or database knowledge by using an intuitive drag & drop interface to analyze the database. The result is displayed as a chart or as a table and can be used later on for internal and external reporting purposes. Within minutes customers can connect datapine to their existing databases or external interfaces, such as Google Analytics. Datapine enhance dashboards with style elements such as headlines, text boxes and images and provide optional interactive control elements…
• Ad hoc queries
• Drag & Drop UI
• Powerful filters
• Full tablet support
• Perform advanced Calculations
Contact for Pricing
Datapine Business Intelligence
MicroStrategy
MicroStrategy makes sophisticated functionality accessible to every user, from administrators to business analysts. MicroStrategy makes it easy to seamlessly connect to any enterprise resource, including databases, mobile device management (MDM) systems, enterprise directories, cloud applications, physical access control systems, and more. MicroStrategy delivers a broad set of business intelligence services that can be deployed on-premises with MicroStrategy Server or via the MicroStrategy Secure Cloud. This service-oriented architecture dynamically assembles metadata objects and provides the core analytical processing power for any business intelligence project. MicroStrategy analytics platform meets the needs of business and IT. It empowers organizations to make sense of…
• Low total cost of ownership
• Enterprise readiness.
• Ease of use.
• Self-service analytics
• Advanced analytics
$600 per user
Contact for Pricing
Pyramid Analytics
Pyramid Analytics deliver a Governed Data Discovery and Enterprise Business Analytics platform that gives the power of analytics into the hands of every user, from expert analyst to business executive to IT professional. The BI Office Suite is architected with centralized security and content in addition to being able scale up and out effortlessly, load balanced over as many servers as required. Pyramid Analytics main product, BI Office, is a web-based business analytics suite for analytics, dashboards, reporting and data mining designed for taking BI to the cloud.BI Office is made up of these core applications: Data Discovery, Data Modeling,…
• Data Discovery, Story Boards and Publications all out of the box
• Increase the return on your SAP investments
• Self-service capabilities without security or data risks
• Easy to use, familiar interface for short ramp up time
Contact for Pricing
Birst BI
Networked BI creates a set of interwoven BI instances that share a common analytical fabric. This enables organizations to expand the use of BI across multiple regions, departments and customers in a more agile way, and empowers these decentralized teams to augment their enterprise data with their own local data. Networked BI is different, allowing both top-down and bottom-up blending of data. The result is local execution with global governance, eliminating data silos once and for all and dramatically accelerating the delivery of BI across the enterprise. Birst’s Networked BI platform redefines the way BI is delivered and consumed, eliminating…
• Rapidly unifies complex data
• Broad and complete business visibility, fast
• Analyze complex processes & models
• Real time sync across users and departments
• Blends centralized and decentralized
• Enable local agility with global analyses
• Trust and reuse key metrics
Contact for Pricing
WebFOCUS Platform
WebFOCUS, is a comprehensive and flexible BI and analytics platform, offers simple to sophisticated analytical tools and apps that enable the visual exploration and answering of a broad range of business questions for users inside and outside the enterprise. Three editions of the product are designed to deliver the many benefits of governed self-service apps and tools to your entire universe of business stakeholders, from management to employees to partners to customers to citizens. WebFOCUS offers self-service analytics with Dashboards and scorecards give executives and managers a high-level view of critical indicators and metrics, Self-service tools allow users to easily…
• Data Discovery
• Predictive Analytics
• Reporting
• Dashboards
• In-Document Analytics
• Location Analytics
• Big Data and the Internet of Things
Contact for Pricing
SAP BusinessObjects BI
SAP BusinessObjects BI solutions are designed to empower organization to achieve remarkable results by enabling trusted data discovery. The solutions help you to transform decisions by providing fact-based information, regardless of where data resides. Using SAP BusinessObjects BI solutions, organization gains increased visibility of key performance indicators (KPIs) across lines of business, improves relationships with customers and suppliers, saves time and money, and can respond faster when exceptions occur. SAP BusinessObjects BI provides Ad-hoc reporting and analysis and Multidimensional analysis. Answer new and evolving business questions with self-service ad-hoc reporting and analysis – on the Web, your desktop, or a…
• Gain real-time business intelligence from any data
• Increase user autonomy by exposing data in plain business terms
• Make information consumption simple, personalized, and dynamic
• Benefit from a flexible and scalable information infrastructure
Contact for Pricing
Domo
Domo is a cloud-based business management platform that transforms the way business is run. Domo gives CEOs and decision makers across the organization the confidence to make faster, more effective decisions and improve business results by giving them one place to easily access all the information they need. Domo bring together in one platform all the technical components required for business users to get meaningful value from business data. With Domo, users can easily connect, prepare, visualize, collaborate and optimize around data for better decision making and improved performance. By automating and normalizing the way data is collected and presented,…
• Interactive Insights
• 1,000 Apps and growing
• Flexible Deployment Options
• Scale & Performance provisioning
Contact for Pricing
Oracle Business Intelligence
Oracle Business Intelligence simplify your analytics strategy by standardizing on one integrated platform, centralize your data models and metrics for a comprehensive representation of the business and enable business leaders to securely access and explore data no matter where they are via mobile devices and the cloud. Data Visualization in Oracle Business Intelligence offers a rich consumer style experience that is now common across Oracle’s analytics portfolio. Additionally, the entire user experience has been streamlined, demonstrating Oracle’s continued commitment to making analytics as fast, flexible, and friendly as they are powerful and robust. Oracle offers new self service capabilities for…
• Modern analytics platform
• Advanced analytics
• Data visualization
• Mobile
• In-memory enhancements
• Self Service
•Contact for Pricing
Tableau Online
Tableau Online is a hosted version of Tableau Server . Tableau Online makes business intelligence faster and easier than ever before. Publish dashboards with Tableau Desktop and share them with colleagues, partners or customers. Tableau Online makes business intelligence faster and easier than ever before. Publish dashboards with Tableau Desktop and share them with colleagues, partners or customers. Tableau Online is your analytics platform fully hosted in the cloud. Publish dashboards and share your discoveries with anyone. Invite colleagues or customers to explore hidden opportunities with interactive visualizations and accurate data. Tableau Online is a fully hosted solution, so you’ll…
• Share and collaborate in the cloud
• Skip the setup time and hardware cost
• Interact, edit, and author on the web
• Connect to any data anywhere
•Tableau Creator- $70 user/month | billed annually
•Tableau Explorer- $35 user/month | billed annually
•Tableau Viewer $12 user/month | billed annually
Qlik Sense Enterprise
Qlik Sense self-service visualization drive insight discovery with the data visualization app that anyone can use. With Qlik Sense, everyone in your organization can easily create flexible, interactive visualizations and make meaningful decisions. Qlik Sense Desktop Import your own data and experience the power of Qlik Sense. Use simple drag-and-drop interfaces to create flexible, interactive data visualizations. Explore data with smart visualizations that automatically adapts to the parameters you set — no need for developers, data scientists or designers. Qlik Sense offers improved capabilities for business users to load, transform, and enrich their data without the need for complex scripting. Qlik…
• Support self-service visualizations
• Guided analytics apps and dashboards
• Embedded analytics and reporting
Qlik Sense® Business-$30
Qlik Sense® Enterprise-$70
Phocas BI Software
Phocas BI Software : Phocas is a governed data discovery application with an HTML5/Javascript presentation layer, Microsoft.NET business logic layer and Microsoft SQL Server database layer.The web application is deployed on premise or in the cloud on Microsoft IIS7. Access to the application is available to any HTML5 compliant browser running on a desktop or on any mobile device. Phocas delivers a simple, powerful analytical capability that quickly turns data into a chart, graph or map at the click of a mouse or touch of a screen. Phocas dashboards gives a stunning visual summary of data, letting to spot check for…
• Data analytics
• Visualizations
• Dashboards
• Mobile
• Collaboration
• Reporting
Contact for Pricing
Dundas BI
As one of the first providers of data visualizations for business intelligence technologies, Dundas Data Visualization is known for software that powers superior user experiences for data consumption. Dundas’ software (Dundas BI) was designed to help more users, regardless of role, discover deeper insights faster, make better decisions, and achieve greater success. With Dundas, your BI experience is completely personal. Dundas BI is an enterprise-level BI and analytics tool, all in one, fully embeddable platform. With its immense built-in functionality, agile data flows adapted to user’s skills, and fully open APIs, business users and analysts gain the ability to run…
•Dashboards & Reports
•Self-Service Analytics
•One Flexible Platform
•Seamless User Experience
•Embedded Analytics
•White Label BI Solutions
Contact for Pricing
Yellowfin
Yellowfin is designed to support a range of BI users and use cases, and to discover how to instill a culture of data-driven decision-making throughout the organization. Yellowfin is a global Business Intelligence (BI) and analytics software vendor who provides a highly intuitive 100 percent Web-based reporting and analytics solution. Yellowfin is a leader in mobile, collaborative and embedded BI, as well as Location Intelligence and data visualization. Yellowfin’s personalized and interactive dashboards improve business performance at all levels of your organization. Track your corporate KPIs with rich, graphical presentations using maps, graphs and tables. Easily assign goals and collaborate…
• Dashboards that put all your data in one place
• Visualize your data from any angle
• Tell amazing stories with your data
• Yellowfin is mobile
• Connect to all your data
• Yellowfin Analytics-From $50 per user per month
• Yellowfin Stories - From $10 per user per month
• Custom Quote- Contact for Pricing
BIME Analytics
BIME allows to connect to both the online and the on-premise world in the same place to create connections to all data sources, create and execute queries and view dashboards easily - all within BIME's beautifully intuitive interface. Build a dashboard with a mouse and a couple clicks. Share it instantly with the world and let your users drill down, drill through and filter the data. BIME have one of the most advanced cross-platform and cross-rendering charting frameworks and all needed is a browser and dynamically ensure maximum reach across all devices.Features include classics plus maps, relational analysis, bullet charts,…
• Make data joins without SQL
• Set up email alerts
• Brand your dashboards
• Share your queries
• Instant forecasting
• Base - $ 490 mo
• Big Data - $ 690 mo
Looker
Looker is a web-based business intelligence platform that brings people and data together. Looker puts actionable data in the hands of the people who need it most, through a unique data description language called LookML. LookML is a easy-to-use modeling language for encapsulating business logic, defining important metrics once and then reusing them throughout the model. Using LookML, analysts can create and curate custom data experiences so any employee can explore and utilize the data that’s most relevant to them. Looker was built from the ground up to enable Big Data processing, leveraging dialect-specific SQL and analytic functions within backend…
•Better insights, better outcomes
•Modern APIs for integrated workflows
•Business Intelligence
•Embedded Analytics
•Workflow Integration
Contact for Pricing
Izenda
Izenda is a web-based embedded business intelligence (BI) platform that has been purpose-built for OEM use and embedding by software companies. It gives software product teams the ability to enhance their applications with white-labeled self-service analytics in the form of dynamic reports, dashboards and visualizations that deliver data-driven insights to users, while maintaining the look and feel of the existing application. Izenda can be deployed as a self-service analytics portal, or seamlessly integrated with Software as a Service (SaaS), on-premise or hybrid applications on any technology stack. The platform leverages a modern, 3-tier embedded architecture that is lightweight, modular and…
• 100% white labeled integration
• Rapid to deploy, easily customizable, and intuitive for your users to configure
• Built to work for your product, your users, and their data
Contact for Pricing
InetSoft Style Intelligence
InetSoft's Style Intelligence is a data intelligence platform. At its foundation is a powerful data mashup engine that enables fast and flexible transformation of data from disparate sources, which can either supplement or obviate a data warehouse solution. At the development level, a unified interface allows for easy and advanced data manipulation and design of interactive dashboards, visual analyses, and published reporting. At the consumption level, self-service is maximized for a range of users, from casual business or consumer-type browsers to power users and data scientists. As a cloud-ready, fully scalable enterprise-grade platform with granular security, multi-tenancy support, and multiple…
• Data Access and Mashup
• Visualizations, Dashboards and Visual Business Analytics
• Enterprise Reporting
• Unified Business Intelligence Software
Contact for Pricing
TARGIT Decision Suite
TARGIT Decision Suite is a business intelligence platform that offers visual data discovery tools, self-service business analytics, reporting, and stunning dashboards in a single, integrated solution. TARGIT supports the decision-making process in a world that's changing faster than ever. TARGIT’s business intelligence software combines all the disciplines—from financial reporting to self-service visual data discovery—in one business intelligence platform that can be deployed across the entire organization. TARGIT Decision Suite is an enterprise-wide platform with a vast range of deployment options that can bring centralized business intelligence to everyone in the organization. The solution’s self-service capabilities enable business users to create…
•Dashboards
•Analytics
•Data Discovery
•Reporting
•Data Visualization
Contact for Pricing
TIBCO Spotfire Cloud
https://www.tibco.com
TIBCO Spotfire Cloud, is an intuitive interface, and simple connectivity to stored or real-time data. Spotfire visualizations are brilliant easy to understand and easy to share with anyone, directly or embedded in web pages, helping you quickly act on your data analyses. TIBCO Spotfire Cloud Contextual Collaboration lets you create conversation threads to quickly disseminate your visualization and discuss with colleagues or customers. Armed with the facts and clear communication, you can make the right decisions as one unified team. TIBCO Spotfire Cloud is data analytics software-as-a-service designed for data mining. Everything you need is available on the cloud —…
https://www.tibco.com
Logi Analytics
Logi Info is a business analytics platform for rapidly creating analytic applications, deploying scalable dashboards and reports, delivering managed self-service analytics to business users, and embedding analytics into the applications workers use every day. Logi Info includes new interactive visualizations, self-service dashboard authoring, and real-time charts. Updates include faster application development, integration with GIT and TFS, and 2x – 10x faster performance. Logi Analytics, is a leader in self-service analytics, and Logi provides self-service analytics tailored to the unique skills and needs of every individual. Logi consists of Logi DataHub, Logi Info business intelligence (BI) platform and Logi Vision data…
• Connect to Any Data Source
• Create a Unique Experience
• Adaptive Security
• Complete Customization
• Designed to Scale
• Engage Users with Self-Service Analytics
Contact for Pricing
Clear Analytics
Clear Analytics is a self-service data consolidation tool, Business Intelligence and Reporting tool-all in one. Clear Analytics goals not only to make those data available across the enterprise but also to provide a range of business information analytics and data visualizations. Clear Analytics empowers proficient Excel users to take advantage of that tool’s powerful BI capacities on a much larger data set through centralized storage of and access to their business’s spreadsheets. Spreadsheets are centralized, and access to them is managed in line with to clear business rules. Business users have the freedom to select fields, aggregate, filter, create calculated…
•Control analysis and reporting
•Create and execute custom queries
•Microsoft Excel–based technology
•Powerful spreadsheet control and management
•Flexible access control
•team edition $ 89 / MO
•small business $ 189 / MO
Socrata Open Performance
https://socrata.com
Socrata Open Performance provides solutions exclusively for city, county, state and federal government organizations, allowing government data to be discoverable, usable and actionable for government knowledge workers and the citizens that is being served.Socrata Open Performance features Socrata Publica where in it allows users to easily publish data to the web and ensure that all interested parties would be able to discover it. Socrata Open Performance also provides multiple tools to ensure that the company’s data is surfaced as often as possible for the right audience at the right time. Obtain insights for the businesses most popular datasets including summary…
•Innovative Visualizations
•Huge Number of Data Sources
•Responsive Dashboards
•Support Team
STANDARD
STANDARD PLUS
PREMIUM
PREMIUM PLUS
https://socrata.com
Wunderdata
Wunderdata is a SaaS Business Intelligence solution that gives its users all data sources in one place. It negates the need to code or to build reports and the KPIs & visual charts work out of the box. Wunderdata imports data from various sources such as its users’ shop databases, ad platforms and CRM applications. The data can be uploaded as CSV files, synchronized via Google Spreadsheets or directly entered into the Wunderdata system through a web interface. Irrespective of the method used, data is only transferred through encrypted connections like SSH and SSL ensuring that all safety regulations are…
Preconfigured reports optimized for eCommerce
Table builder for custom reports
Global filtering and slicing & dicing
Advanced calculations like marketing ROI, contribution margins, customer lifetime value and cohort analysis
Management of users and data access rights
Automated email reports
Unlimited users and reports
Free implementation and support from Wunderdata business intelligence experts
Starter: € 199/ month
Basic: € 349/ month
Professional: € 649/ month
Platinum: € 1199/ month
https://wunderdata.com/
OQLIS
OQLIS makes it easy to quickly visualise the data without losing any of the detail, at its heart OQLIS is an analytics technology built into a web app, the user can build your organisation a completely tailored experience, hosted in the cloud, its accessible through the web, mobile device or embedded into a custom application. OQLIS executes in database, therefore we do not move subsets of data, so the user can access data quickly and using own infrastructure. OQLIS has Browser Based UI which is simple, elegant, HTML5-based search interface that offers search suggestions when the user types and creates…
•Database intellisense.
•Drag and drop explore.
•Multiple chart types.
•Embedded visualizations.
•LITE: $275/ Month
•STANDARD: $550/ Month
Saasabi Pro
http://www.saasabi.com
Saasabi Pro is a full-featured data analytics engine that enables sophisticated analysis in an enterprise setting without the need to configure and manage virtual machines. Delivered as software as a service, Saasabi Pro enables complex reporting, advanced insights and robust, scalable business intelligence applications. SAASABI PRO is an analytical tool. It allows data analysis, report generation and scalable business intelligence. The software delivers simple solution to complex problems. The software is targeted to enterprises. It has been designed in a way so that it meet the information analysis needs of an enterprise. The software extract data from all sources. These…
Data analysis
Data sourcing
Report generation
Information sharing
SAASABI API toolkit to develop solution to match to customers’ needs
Contact for Pricing
http://www.saasabi.com
For a review of the top business intelligence companies, click on the button below:
Top Business Intelligence companies
For a review of the top free Extract, Transform, and Load, ETL Software, click on the button below:
Top Free Extract, Transform, and Load, ETL Software
For a review of open source and free business intelligence Software click on the button below :
Open Source and Free Business Intelligence Software
For a review of Online Analytical Processing Tools click on the button below :
Online Analytical Processing Tools
What is Cloud Analytics? Cloud Analytics is a term used to represent the analysis using cloud computing. Cloud Analytics uses a range of analytical tools and techniques to help companies extract information from massive data and present it in a way to be made accessible via cloud through a web browser. What are the Best Cloud Analytics Software? Sisense, Periscope Data, Microsoft Power BI Pro, IBM Cognos Analytics, ThoughtSpot, GoodData, Amazon QuickSight, Datapine Business Intelligence, MicroStrategy, Pyramid Analytics, Birst BI, WebFOCUS Platform, SAP BusinessObjects BI, Domo, Oracle Business Intelligence, Tableau Online, Qlik Sense Enterprise, Phocas BI Software, Dundas BI, Yellowfin, BIME Analytics, Looker, Izenda, InetSoft Style Intelligence, TARGIT Decision Suite, TIBCO Spotfire Cloud, Logi Analytics, Clear Analytics, Socrata Open Performance, Wunderdata, OQLIS, Saasabi Pro are some of the example of the best Cloud – SaaS – OnDemand Business Intelligence Software.


By clicking Sign In with Social Media, you agree to let PAT RESEARCH store, use and/or disclose your Social Media profile and email address in accordance with the PAT RESEARCH Privacy Policy and agree to the Terms of Use.